
The Australian Bureau of Statistics published its final monthly online retail turnover observation for June 2025. The final Table 21 workbook contains 144 monthly observations from July 2013 to June 2025 for total, food and non-food online retailing in original and seasonally adjusted terms.
A separate 2026 ABS release reported that 32% of businesses received orders online during 2024-25, similar to 30% in 2021-22. That adoption percentage does not measure retail turnover or the share of sales made online, so this report keeps it separate from the monthly retail series.
The tables, source-boundary timeline, accessible chart and normalized CSV are designed for store operators, journalists, researchers and market planners. They describe published activity and adoption. They do not measure search demand, rankings, website traffic, customer intent or the likely return from SEO.
Normalized ABS data
Use the monthly series with its source boundaries intact
Download monthly original and seasonally adjusted retail observations plus separately identified business adoption percentages, source fields and limitations.
Official-source Australian data
The final ABS online retail series at a glance
The final Retail Trade workbook contains 144 monthly observations from July 2013 to June 2025. Values are current-price turnover in millions of Australian dollars. The series covers employing retail businesses that predominantly sell to households.
Total online retailing
$4,703.8m
June 2025, seasonally adjusted
Food online retailing
$1,449.9m
June 2025, seasonally adjusted
Non-food online retailing
$3,253.9m
June 2025, seasonally adjusted
Evidence limit: $4,703.8m is the final seasonally adjusted observation for June 2025. It is not a current 2026 sales estimate, a forecast or evidence that a particular store can win search traffic.
Annual June observations
The chart and table select the June observation from each completed year in the final workbook. The downloadable CSV preserves every monthly original and seasonally adjusted observation.
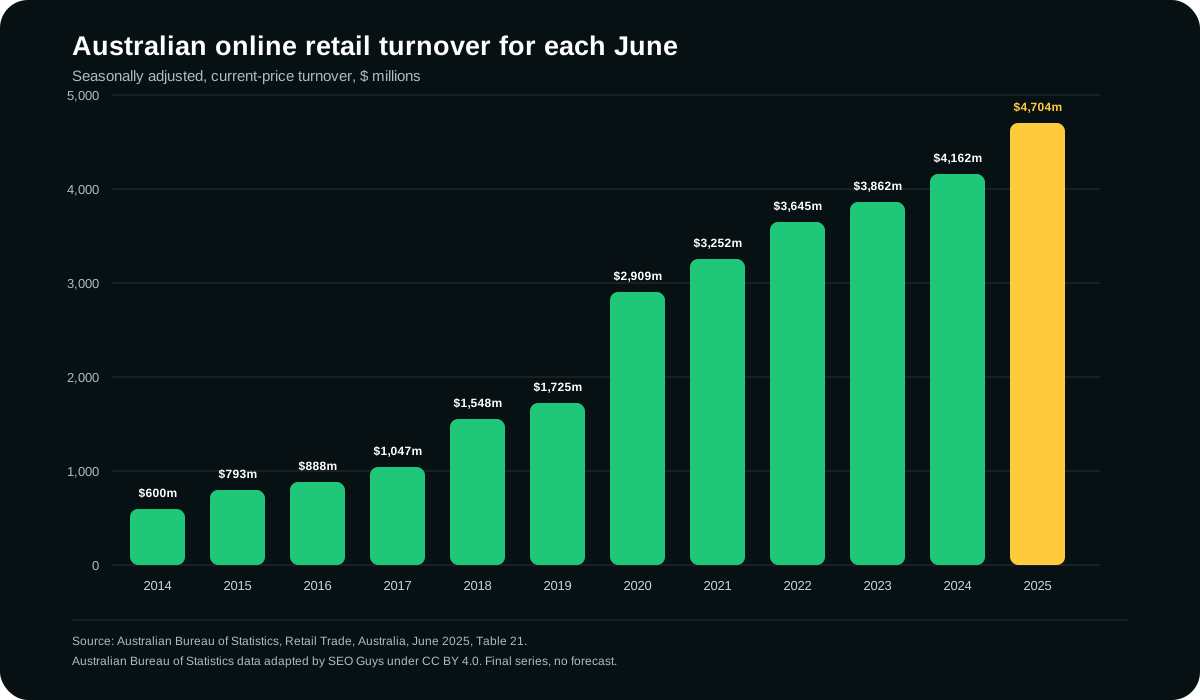
Source: Australian Bureau of Statistics, Retail Trade, Australia, June 2025, Table 21. Adapted by SEO Guys under CC BY 4.0. The chart is descriptive and does not forecast later turnover.
Download accessible chart SVG| Period | Original, $m | Seasonally adjusted, $m |
|---|---|---|
| June 2014 | 602.1 | 600.3 |
| June 2015 | 790.5 | 792.8 |
| June 2016 | 904.1 | 888.3 |
| June 2017 | 1,039.3 | 1,047.4 |
| June 2018 | 1,484.0 | 1,548.4 |
| June 2019 | 1,659.1 | 1,725.1 |
| June 2020 | 2,766.6 | 2,909.2 |
| June 2021 | 3,092.7 | 3,251.8 |
| June 2022 | 3,544.4 | 3,645.4 |
| June 2023 | 3,741.8 | 3,861.5 |
| June 2024 | 4,046.9 | 4,161.7 |
| June 2025 | 4,621.8 | 4,703.8 |
Final month by retail category
Food includes food retailing plus cafes, restaurants and takeaway food services. Non-food contains the other industries in the survey scope. The published online collection does not support a finer industry split.
| Category | Original, $m | Seasonally adjusted, $m |
|---|---|---|
| Total | 4,621.8 | 4,703.8 |
| Food | 1,396.6 | 1,449.9 |
| Non-food | 3,225.2 | 3,253.9 |
The source boundary after June 2025
Retail Trade ended after June 2025. Current ABS household spending and business turnover indicators are broader measures with different source data. They are not a published continuation of the online retail series.
Final workbook series begins
The final ABS Table 21 workbook contains monthly online retail turnover observations from July 2013.
Final reference month
June 2025 is the last reference month in Retail Trade, Australia and the last month in the online retail turnover series.
Final Retail Trade release
The ABS released the final Retail Trade publication and directed users to broader household spending and business turnover indicators.
Replacement indicators remain different
The ABS transition note lists a separate online, or card-not-present, household spending series as a potential future development. It is not a published continuation of Table 21.
Latest business adoption release
Characteristics of Australian Business published a separate 2024-25 measure showing the proportion of businesses that received orders online.
Separate business adoption dataset
Businesses receiving orders online
Characteristics of Australian Business reports a rounded percentage of employing businesses, not a dollar value. A business can be counted after receiving an online order regardless of how much income came from that channel.
| Financial year | Businesses receiving orders online |
|---|---|
| 2021-22 | 30% |
| 2024-25 | 32% |
Do not combine the tables: 32% is not online retail market share, the share of income earned online or a replacement for the June 2025 turnover value. The populations, units and reference periods differ.
Source and reuse record
The download retains the source, release, extraction, licence, attribution and limitation fields beside each observation. The two source populations remain separately identified in every row.
Retail Trade, Australia, June 2025, Table 21
- Reference period
- July 2013 to June 2025
- Release date
- 2025-07-31
- Extraction date
- 2026-08-30
- Licence
- Creative Commons Attribution 4.0 International
- Limitations
- Current-price turnover, including goods and services tax, from employing Australian retail businesses that predominantly sell to households. The series excludes direct imports, household-to-household sales, non-employing businesses and non-resident businesses. An online order does not identify a search or marketing source. The publication ceased after June 2025.
Characteristics of Australian Business, 2024-25
- Reference period
- 2021-22 and 2024-25 financial years
- Release date
- 2026-06-25
- Extraction date
- 2026-08-30
- Licence
- Creative Commons Attribution 4.0 International
- Limitations
- Published rounded percentages of employing businesses that received orders online. This is not the share of sales made online, retail turnover, household spending, website revenue or evidence of search demand.
The CSV contains only ABS-derived observations and SEO Guys metadata. It does not redistribute third-party reports, branding or microdata.
Download normalized data CSVEditor and publisher reuse
Reuse a source-labelled graphic
Each SVG keeps its source, geography, reference period and material limitation visible. Copy the accessible HTML or download the original file, then check the report notes before publication.
Graphic 01
accessible annual June chart SVG
Prefer a plain report citation?
Copy the report title, update date, page URL and source credit as one plain-text reference.
Use is optional. Editors may cite the original government source, change or remove the supplied link, and make their own attribution and link-treatment decisions. The copied code does not require a followed link or a keyword-rich anchor.
What the final online retail series measures
The final ABS release reports $4,703.8 million in total online retailing sales for June 2025 in seasonally adjusted, current-price terms. Food accounted for $1,449.9 million and non-food accounted for $3,253.9 million in that same adjusted observation.
The original June 2025 total was $4,621.8 million. Original values preserve the observed seasonal pattern, while seasonally adjusted values estimate movement after regular seasonal influences are removed. They answer different questions and should remain labelled whenever the figures are quoted.
The normalized CSV includes every month from the final Table 21 workbook for total, food and non-food retailing. It preserves the published original and seasonally adjusted values instead of calculating a replacement series.
Define online retail before using the numbers
For this ABS series, an online sale is a purchase made via the internet from an employing retail business that predominantly sells to households. Payment does not have to occur online. The series excludes direct imports from overseas websites and household-to-household sales through third-party websites.
The figures are monthly current-price turnover, not a volume measure. Price changes can therefore affect the dollar total. The survey scope also excludes non-employing and non-resident businesses, so the series is not a complete count of every ecommerce transaction involving an Australian buyer.
The ABS reports monthly estimates in current-price terms and includes goods and services tax in turnover from July 2000.
Food combines food retailing with cafes, restaurants and takeaway food services. Non-food combines the other in-scope retail industries. The published collection does not support a finer online industry split in this final workbook.
- Keep the category, adjustment and unit beside every value.
- State that the values are in millions of Australian dollars at current prices.
- Use the source reference period rather than calling the figures current 2026 sales.
- Retain the exclusions when describing the size of the series.
Do not splice Retail Trade into a replacement series
The Retail Business Survey and Retail Trade publication ceased after the June 2025 reference period. The ABS directs users to the Monthly Household Spending Indicator and Monthly Business Turnover Indicator for broader current evidence, but those indicators use different concepts, coverage and source data.
The ABS transition note lists a separate series for online, or card-not-present, transactions as a potential future development. It is not part of the currently published replacement outputs. A current household spending total should therefore not be appended to the old online retail series or labelled as online retail turnover.
Historical Retail Trade data remains useful when its final period and survey scope stay visible. For later market context, cite the current ABS indicator directly and explain that it is a different measure rather than presenting a continuous ecommerce line.
Keep business adoption separate from retail turnover
Characteristics of Australian Business reports the proportion of businesses receiving orders online. The published national result was 32% for 2024-25 and 30% for 2021-22. These are rounded proportions of employing businesses, not dollar values.
A business can receive one online order and be included in the adoption percentage, while another business can receive most of its income online. The percentage therefore cannot be converted into turnover, an ecommerce market share or an average online revenue figure.
The adoption measure covers a broader employing-business population than the Retail Trade online turnover series. Keep the datasets in separate tables, quote their own populations and do not add or average their values.
What the official data cannot decide for one store
National turnover can provide market context, but it does not show the search demand, competitive result pages, margins, stock position, customer fit or implementation condition of one store. It also cannot attribute an order to organic search, paid media, email, direct traffic or another channel.
Use store-level catalogue, Search Console, analytics, commerce, margin and fulfilment evidence for prioritisation. Keep those measurements separate and record the change, page group and time period before interpreting movement.
This report does not forecast online sales, traffic, rankings, enquiries or revenue. A growing or declining market observation does not establish that an SEO project will succeed or fail.
Download, cite and reuse the data
The CSV contains normalized period, geography, measure, category, adjustment, value, unit, series identifier, source URL, release date, extraction date, licence, attribution and limitation fields. Retail observations come from the final ABS Table 21 workbook. The two business adoption observations reproduce the rounded values stated in the ABS release.
ABS material is available under the Creative Commons Attribution 4.0 International licence except for listed exclusions. This resource uses ABS statistics and text-based source facts only. It does not reproduce the ABS logo, Commonwealth Coat of Arms, third-party material, microdata or protected branding.
When quoting an official number, cite the relevant ABS release directly. When using the normalized CSV or the original SEO Guys chart, credit the ABS data source and link to this report so readers can inspect the transformation, extraction date and limitations. Do not imply that the ABS produced or endorsed the SEO Guys presentation.
- Retain the source URL, release date and reference period.
- Retain the Creative Commons attribution and limitations.
- Identify whether a value is original, seasonally adjusted or a rounded percentage.
- Do not imply ABS endorsement of the adapted chart or CSV.
Sources and further reading
Primary and authoritative sources used to support the factual guidance in this resource.
- Source 01ABS Retail Trade, Australia, June 2025, opens in a new tabFinal release for monthly retail turnover, including the online retail tables and Table 21 workbook.
- Source 02ABS Retail Trade methodology, June 2025, opens in a new tabOfficial definitions, survey scope, current-price treatment, exclusions, seasonal adjustment and online-sales notes.
- Source 03ABS cessation of Retail Trade, opens in a new tabOfficial notice confirming the final June 2025 reference period and the transition to broader indicators.
- Source 04ABS Monthly Household Spending transition plan, opens in a new tabOfficial scope of the enhanced indicator and the potential future online and card-present split.
- Source 05ABS Characteristics of Australian Business, 2024-25, opens in a new tabPrimary release for the published 2024-25 and 2021-22 online-order adoption percentages.
- Source 06ABS Characteristics of Australian Business methodology, opens in a new tabOfficial scope, collection, business population, quality and terminology guidance for the adoption measure.
- Source 07ABS copyright and Creative Commons terms, opens in a new tabOfficial reuse terms, exclusions and attribution requirements for ABS website material.