
Supplied source graphics
Every case study includes the supplied annotated Google Search Console graphic so you can inspect the chart and reported totals yourself.
Each case study separates what the chart visibly shows from what the data suggests should be investigated next. Search Console does not show leads or revenue, so we do not claim either without supporting data.
Good SEO reporting should make the source, result and limitation easy to understand.
Every case study includes the supplied annotated Google Search Console graphic so you can inspect the chart and reported totals yourself.
Clicks, impressions, click-through rate and average position are reproduced only when they are readable in the source image.
Search Console does not prove revenue, enquiries or causation. We do not add those claims when the supporting data is not present.
Download a monthly reporting structure that keeps source data, completed work, limitations and the next decision together.
Search performance from Australian client campaigns, documented with the supplied annotated Google Search Console graphics and the numbers visible in each report.
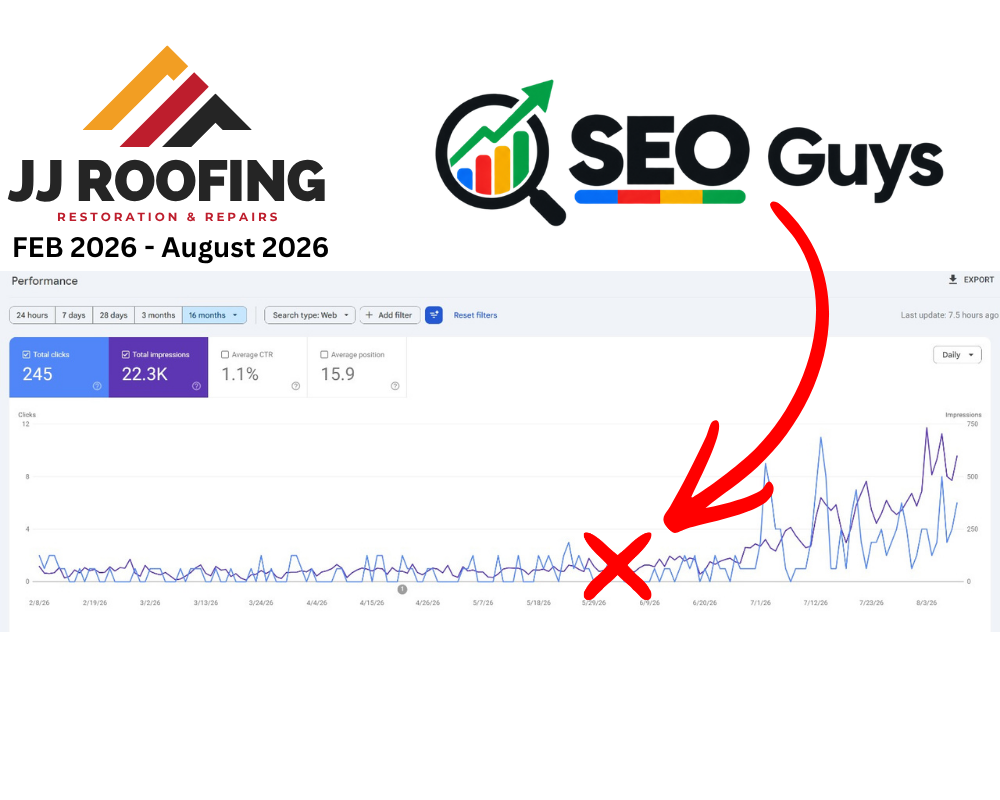 Read case study
February to August 2026
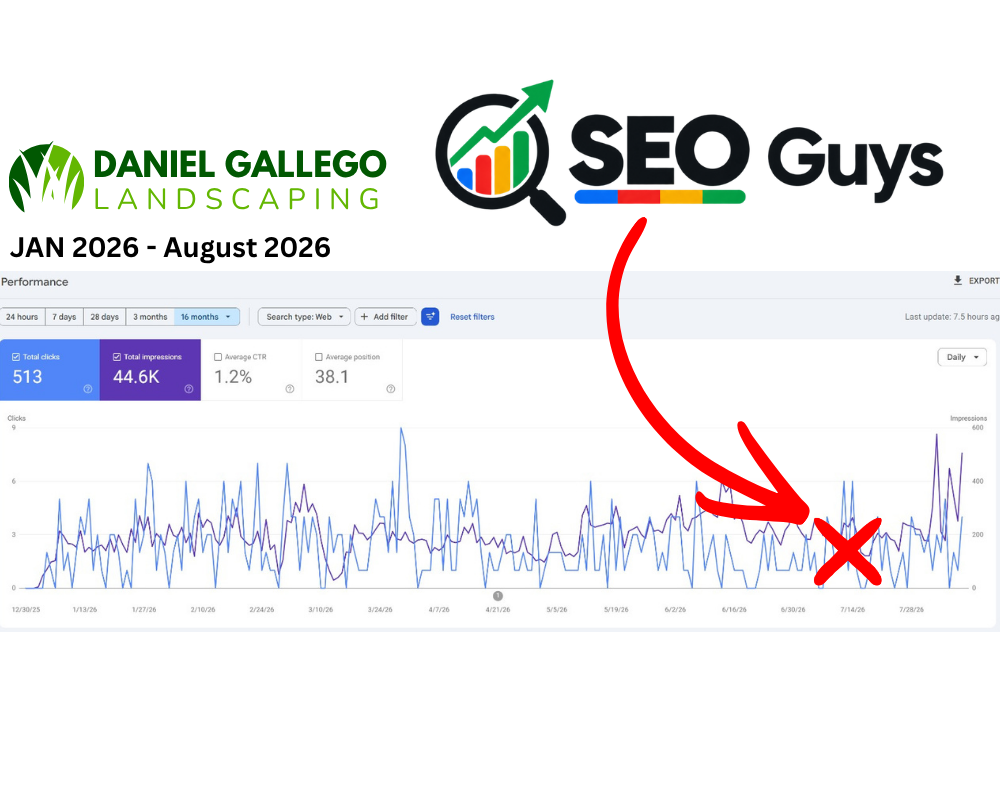 Read case study
January to August 2026
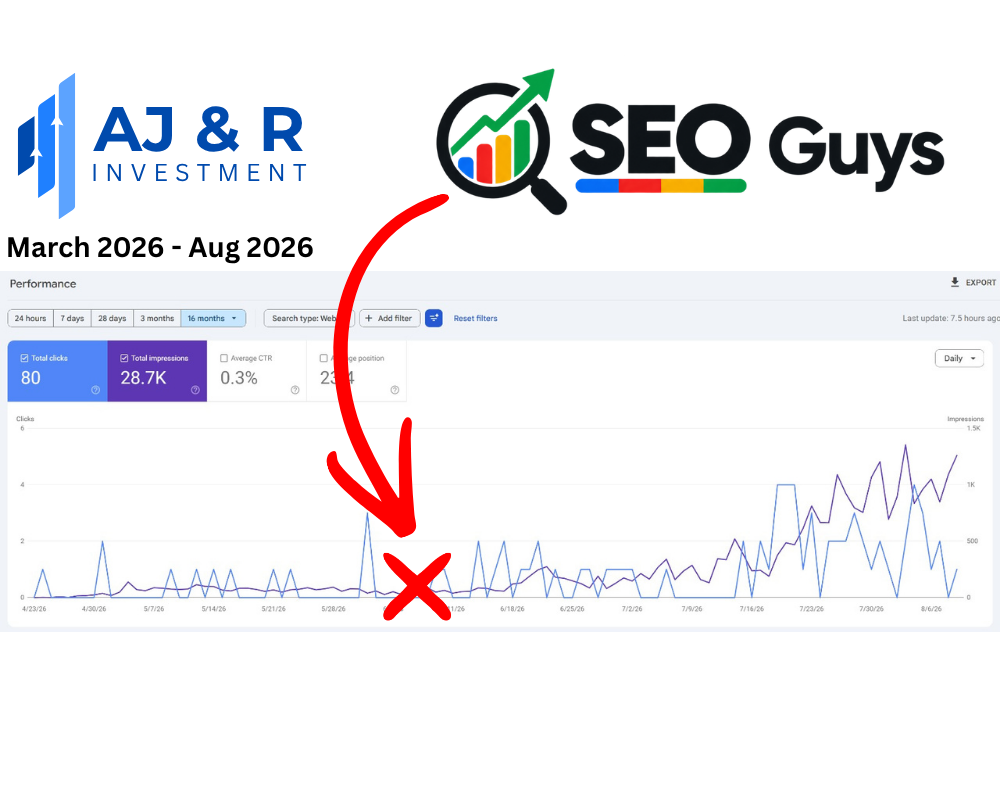 Read case study
March to August 2026
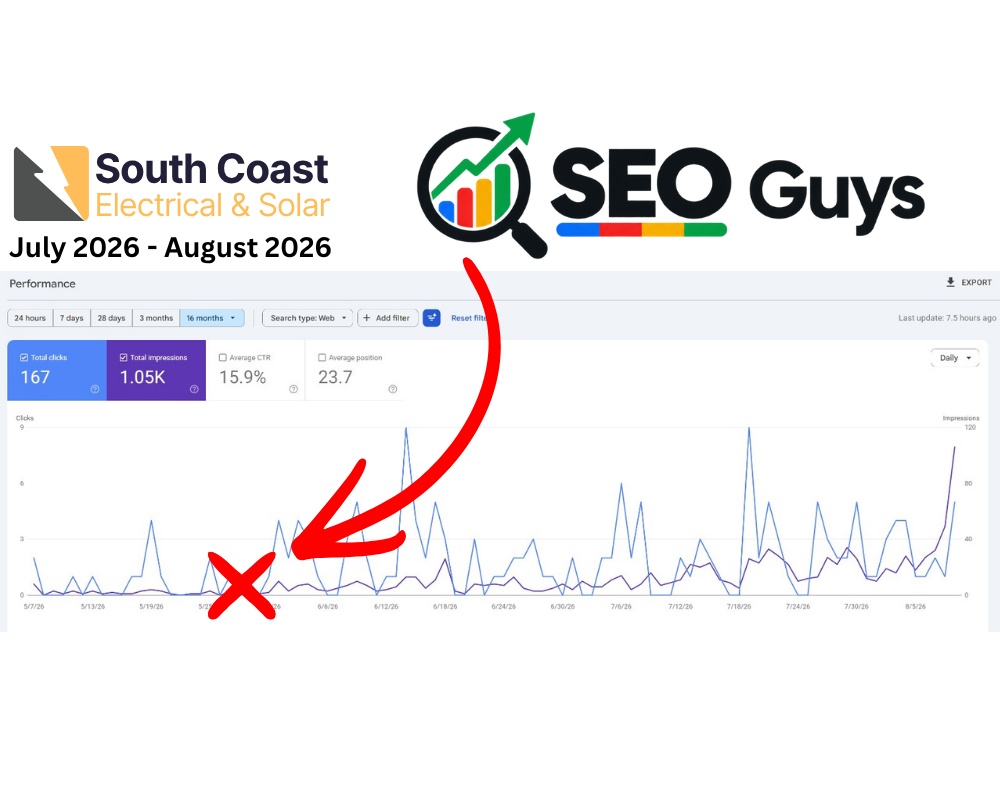 Read case study
July to August 2026