
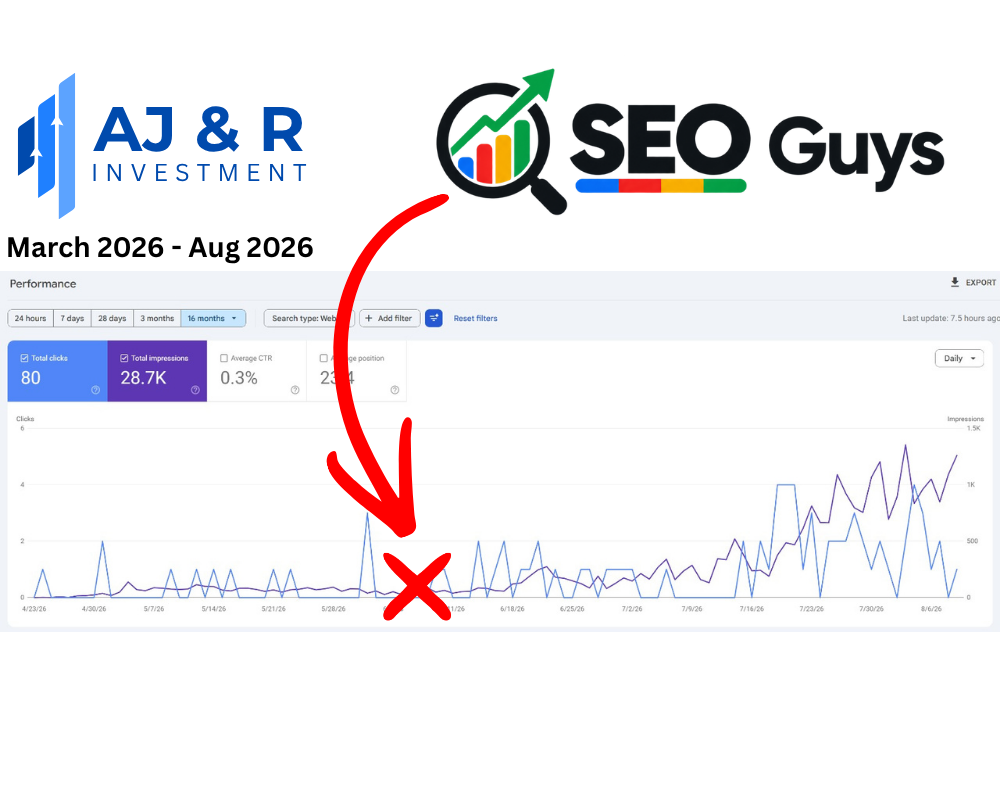
Impressions moved into a new range
The latter portion of the chart sits visibly above the quiet opening baseline and includes repeated large peaks.
The chart shows impressions accelerating from a low starting point into repeated higher peaks, reaching 28.7K impressions across the displayed period.
Discuss your SEO opportunityTotal clicks: Visits from unpaid Google Search results during the displayed period.
Impressions: Times an AJ and R Investment result appeared in Google Search.
Average CTR: The share of recorded impressions that became a click.
The observable story
The opening section of the chart sits close to the baseline. Impressions are present but modest, and clicks arrive in isolated peaks rather than as a consistent stream.
The impression line begins lifting more clearly around the middle of the reporting period. From mid-July, it climbs into a new range and produces repeated high points through the end of the screenshot.
That movement produces 28.7K total impressions, while clicks total 80 and the average click-through rate is 0.3%. The picture is therefore one of rapid discovery growth where search exposure has developed faster than search traffic.
Three observations taken directly from the supplied Search Console snapshot.
The latter portion of the chart sits visibly above the quiet opening baseline and includes repeated large peaks.
Clicks increased in places, but the 0.3% average CTR shows that most search appearances did not become visits.
Several elevated impression points appear across the final weeks, which is stronger evidence than a single exceptional day.
Opportunity, not attribution
These are opportunities suggested by the snapshot, not a claim about work already completed.
Evidence note: Source: the supplied Google Search Console performance screenshot labelled March to August 2026. The average position value is not reproduced because it is obscured in the supplied image. Results are client-specific and are not a guarantee of future performance.
Compare the shape and scale of the other supplied Search Console snapshots.
Learn how to interpret click-through rate and turn dated search evidence into a clear monthly decision.
Tell us where your website is now and what a commercially useful result would look like for your business.