
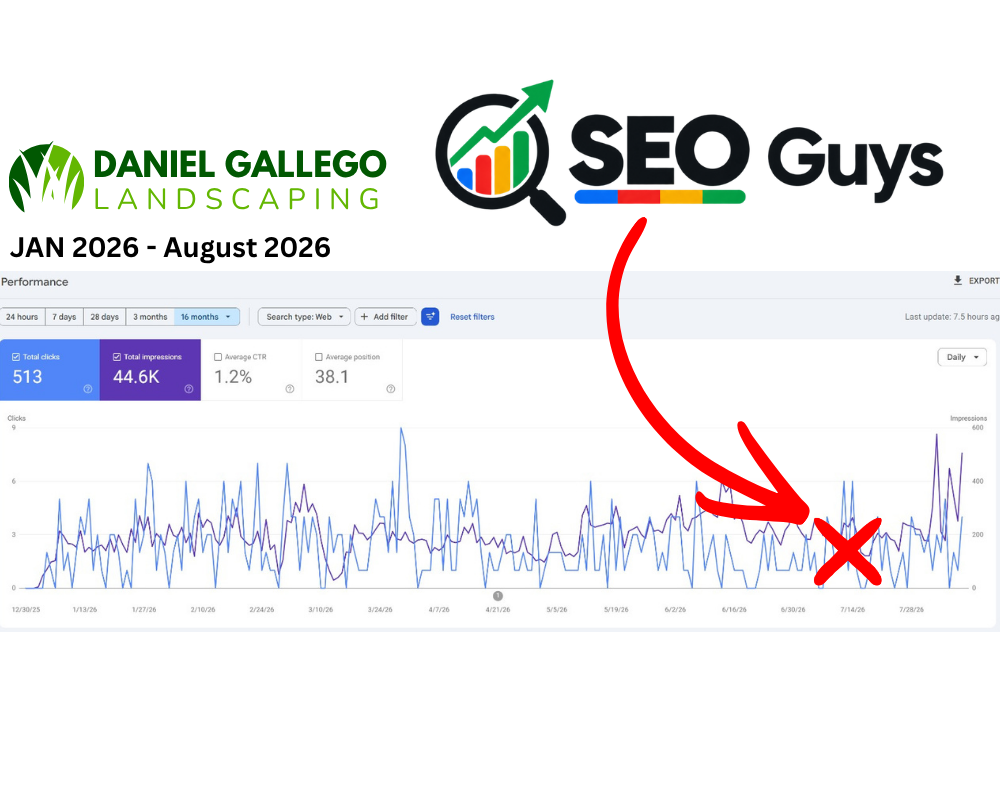
Search demand was present throughout
The website recorded impressions and clicks across the full chart rather than relying on one isolated spike.
This is the largest search footprint in the supplied set, with 44.6K impressions and 513 clicks recorded across the displayed period.
Discuss your SEO opportunityTotal clicks: Visits from unpaid Google Search results during the displayed period.
Impressions: Times a Daniel Gallego Landscaping result appeared in Google Search.
Average CTR: The share of recorded impressions that became a click.
Average position: The average highest position reported across tracked search appearances.
The observable story
Unlike a chart that starts from almost no activity, this snapshot shows search visibility throughout the reporting period. Both lines fluctuate from week to week, with regular impressions and clicks visible from January onward.
From June, the impression line spends more time above its earlier baseline. The chart then records its largest impression peaks near the end of July and in early August, while clicks continue to arrive in a more uneven pattern.
The result is meaningful reach, with 44.6K search appearances and 513 clicks. The average position of 38.1 also shows that visibility was spread across rankings with substantial room to move closer to the first page.
Three observations taken directly from the supplied Search Console snapshot.
The website recorded impressions and clicks across the full chart rather than relying on one isolated spike.
The highest visible impression points are concentrated near the close of the reporting period.
A 38.1 average position indicates broad discovery, but many search appearances are likely occurring well beyond page one.
Opportunity, not attribution
These are opportunities suggested by the snapshot, not a claim about work already completed.
Evidence note: Source: the supplied Google Search Console performance screenshot labelled January to August 2026. Results are client-specific and are not a guarantee of future performance.
Compare the shape and scale of the other supplied Search Console snapshots.
Learn how to interpret click-through rate and turn dated search evidence into a clear monthly decision.
Tell us where your website is now and what a commercially useful result would look like for your business.