
Australia had 2,814,778 actively trading market-sector businesses at 30 June 2026. This report turns the latest Australian Bureau of Statistics data into clear tables, charts and a normalized CSV for journalists, business owners, researchers and market planners.
The report compares business growth across every state and territory, 19 industry divisions, non-employing businesses, total employing businesses and four detailed employing bands. A separate 2025 layer compares eight Greater Capital City Statistical Areas on one geography level and keeps the Gold Coast LGA visibly separate.
SEO Guys prepared this independent synthesis from official ABS releases. The ABS did not produce or endorse the analysis. Every headline figure is linked to the primary release and the limitations are stated so the data is not mistaken for search demand or a ranking forecast.
Free source-backed dataset
Download the normalized Australian business data
Use the CSV for research, reporting and market planning. Each row includes its reference period, ABS table, stable source URL, release date, licence and attribution.
Source-backed 2026 report
Australian business growth at a glance
At 30 June 2026, Australia had 2,814,778 actively trading businesses in the market sector. The count increased by 85,130 during 2025-26 as 460,461 entries exceeded 375,331 exits.
Actively trading businesses
2,814,778
At 30 June 2026
Net annual growth
+85,130
+3.1%
Business entries
460,461
16.9% entry rate
Business exits
375,331
13.8% exit rate
What this count means: the ABS measures actively trading businesses in the Australian market sector. This is not the same as the total number of entities holding an ABN. Use the figures to understand market structure, then validate an SEO opportunity with search demand, customers, service capacity and competition.
Business growth by state and territory
Every state and territory recorded growth in 2025-26. New South Wales added the most businesses in absolute terms, while Western Australia recorded the highest percentage growth at 4.6%.
Download an editor-ready SVG with the source, date, licence and demand limitation included in the artwork.
Download reusable chart SVG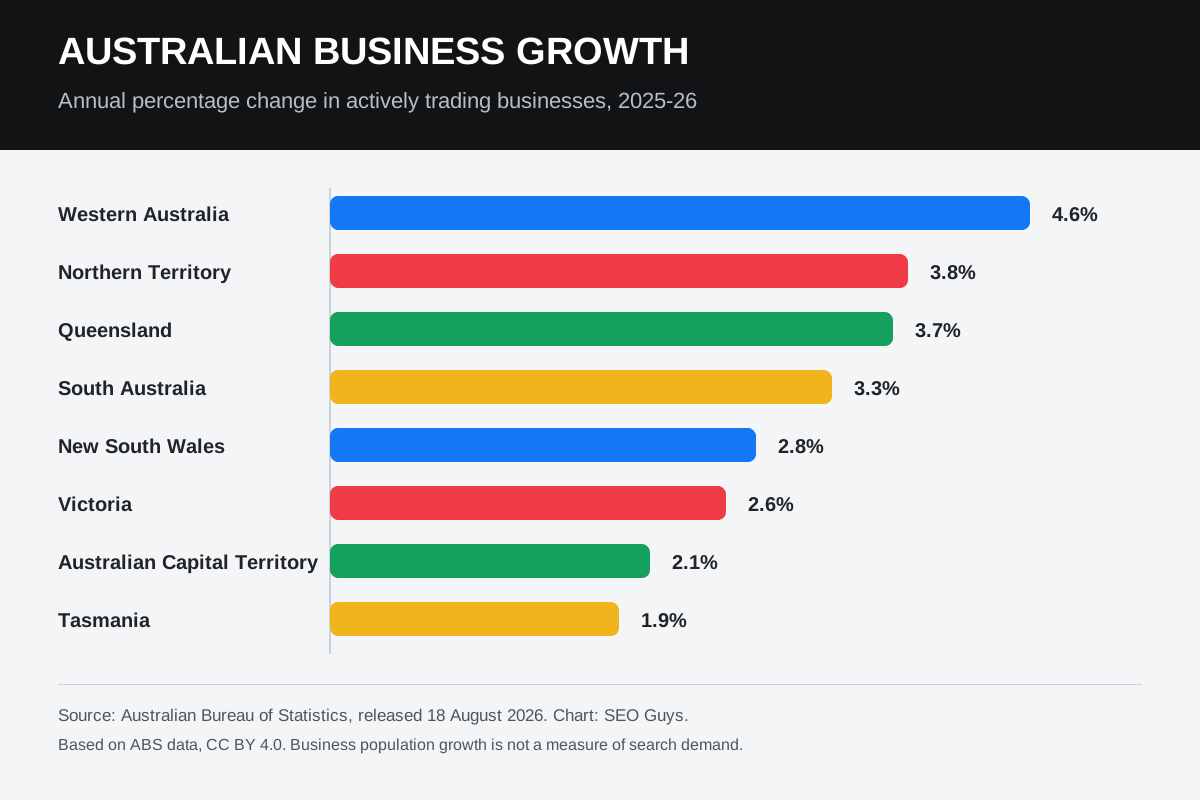
| State or territory | Businesses | Annual change | Entry rate | Exit rate |
|---|---|---|---|---|
| New South WalesSydney SEO | 942,658 | +26,057 (+2.8%) | 16.9% | 13.9% |
| VictoriaMelbourne SEO | 773,986 | +19,581 (+2.6%) | 17.0% | 14.4% |
| QueenslandBrisbane SEO, Gold Coast SEO | 543,277 | +19,244 (+3.7%) | 16.9% | 13.4% |
| South AustraliaAdelaide SEO | 174,310 | +5,613 (+3.3%) | 15.7% | 12.3% |
| Western AustraliaPerth SEO | 278,520 | +12,248 (+4.6%) | 17.5% | 13.1% |
| TasmaniaHobart SEO | 45,094 | +850 (+1.9%) | 13.3% | 11.6% |
| Northern TerritoryDarwin SEO | 17,440 | +643 (+3.8%) | 18.5% | 14.1% |
| Australian Capital TerritoryCanberra SEO | 37,785 | +789 (+2.1%) | 17.9% | 15.0% |
The eight rows exclude 1,708 businesses recorded by ABS under other territories or currently unknown. Capital-city links provide search-market context and should not be read as state-wide business counts for those cities.
Same-level capital-city evidence
Compare eight Australian capital-city business profiles
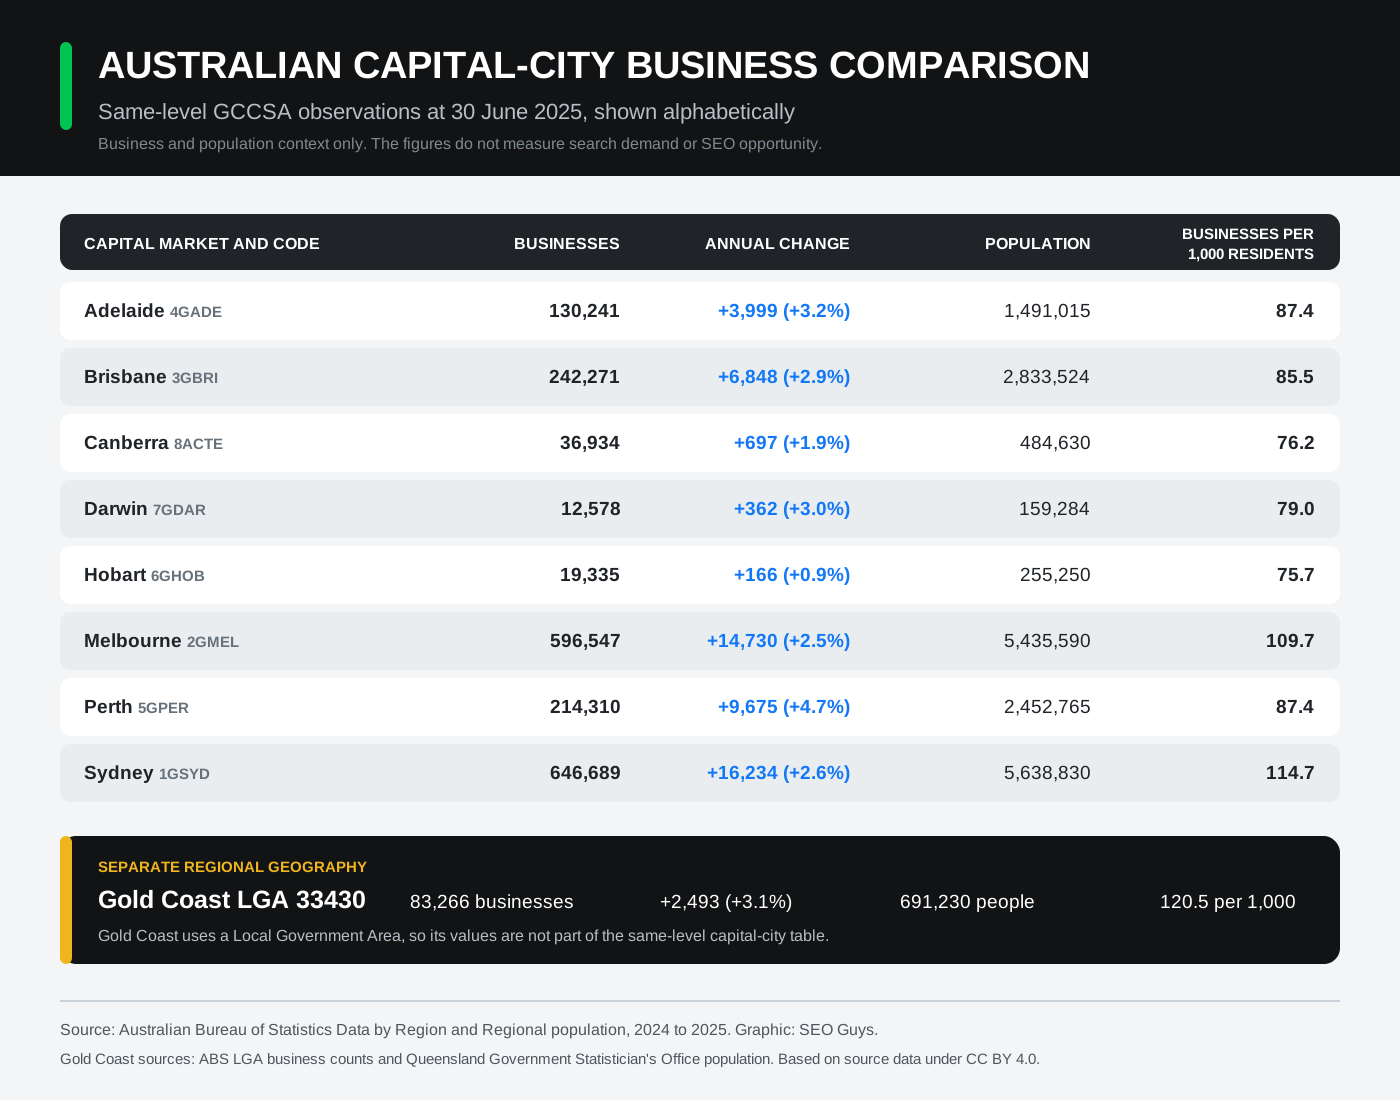
Each row uses one Greater Capital City Statistical Area and the same 30 June 2025 observation date. Rows are alphabetical, not ordered by performance. The table keeps the geography code, reference period and detailed local report one click away.
8
same-level capital-city regions
2025
common business and population year
1
separately scoped Gold Coast market
| Capital market | Businesses | Annual change | Population | Businesses per 1,000 residents |
|---|---|---|---|---|
| AdelaideGCCSA 4GADEExplore Adelaide SEO | 130,241 | +3,999+3.2% | 1,491,015 | 87.4 |
| BrisbaneGCCSA 3GBRIExplore Brisbane SEO | 242,271 | +6,848+2.9% | 2,833,524 | 85.5 |
| CanberraGCCSA 8ACTEExplore Canberra SEO | 36,934 | +697+1.9% | 484,630 | 76.2 |
| DarwinGCCSA 7GDARExplore Darwin SEO | 12,578 | +362+3.0% | 159,284 | 79.0 |
| HobartGCCSA 6GHOBExplore Hobart SEO | 19,335 | +166+0.9% | 255,250 | 75.7 |
| MelbourneGCCSA 2GMELExplore Melbourne SEO | 596,547 | +14,730+2.5% | 5,435,590 | 109.7 |
| PerthGCCSA 5GPERExplore Perth SEO | 214,310 | +9,675+4.7% | 2,452,765 | 87.4 |
| SydneyGCCSA 1GSYDExplore Sydney SEO | 646,689 | +16,234+2.6% | 5,638,830 | 114.7 |
Business count change is the difference between the published 2024 and 2025 snapshots. It is not a count of entries, exits or surviving businesses. Businesses per 1,000 residents is an SEO Guys calculation using the two published 2025 values.
Verify and reuse the comparison
The normalized CSV keeps every geography code, source URL, reference period, calculation and limitation beside the value. The accessible SVG keeps the capital-city table and separately scoped Gold Coast note visible for reuse. Both files are available in the source-backed download section above.
Return to the download filesBusiness growth by industry
Health Care and Social Assistance had the strongest percentage growth at 6.7%. Construction remained the largest industry count in this table at 478,651 businesses. Agriculture, Forestry and Fishing was the only industry to contract.
| Category | Businesses | Annual change | Entry rate | Exit rate |
|---|---|---|---|---|
| Agriculture, Forestry and Fishing | 170,185 | -861 (-0.5%) | 7.4% | 7.9% |
| Mining | 8,755 | +95 (+1.1%) | 12.0% | 10.9% |
| Manufacturing | 90,879 | +192 (+0.2%) | 12.5% | 12.3% |
| Electricity, Gas, Water and Waste Services | 9,168 | +280 (+3.2%) | 16.5% | 13.3% |
| Construction | 478,651 | +15,603 (+3.4%) | 17.9% | 14.6% |
| Wholesale Trade | 82,448 | +379 (+0.5%) | 13.6% | 13.1% |
| Retail Trade | 156,143 | +125 (+0.1%) | 15.7% | 15.7% |
| Accommodation and Food Services | 114,369 | +1,498 (+1.3%) | 17.1% | 15.7% |
| Transport, Postal and Warehousing | 261,109 | +12,127 (+4.9%) | 26.5% | 21.7% |
| Information Media and Telecommunications | 26,250 | +1,002 (+4.0%) | 18.6% | 14.7% |
| Financial and Insurance Services | 139,417 | +5,749 (+4.3%) | 16.7% | 12.4% |
| Rental, Hiring and Real Estate Services | 319,717 | +11,511 (+3.7%) | 13.1% | 9.4% |
| Professional, Scientific and Technical Services | 366,289 | +12,804 (+3.6%) | 17.2% | 13.5% |
| Administrative and Support Services | 130,330 | +3,299 (+2.6%) | 20.3% | 17.7% |
| Public Administration and Safety | 7,908 | +137 (+1.8%) | 19.4% | 17.6% |
| Education and Training | 44,236 | +1,190 (+2.8%) | 16.5% | 13.8% |
| Health Care and Social Assistance | 227,702 | +14,278 (+6.7%) | 17.4% | 10.7% |
| Arts and Recreation Services | 40,792 | +1,500 (+3.8%) | 18.1% | 14.3% |
| Other Services | 138,735 | +4,213 (+3.1%) | 17.1% | 14.0% |
Business counts by employment size
Non-employing businesses accounted for almost all net growth. They increased by 83,105, while the total number of employing businesses increased by 2,025. The ABS notes this was the first rise in employing businesses since 2021-22.
| Category | Businesses | Annual change | Entry rate | Exit rate |
|---|---|---|---|---|
| Non-employing | 1,818,575 | +83,105 (+4.8%) | 20.4% | 17.2% |
| Total employing | 996,203 | +2,025 (+0.2%) | 10.7% | 7.7% |
| 1 to 4 employees | 689,600 | +730 (+0.1%) | 14.1% | 9.1% |
| 5 to 19 employees | 232,912 | +783 (+0.3%) | 3.6% | 5.1% |
| 20 to 199 employees | 68,325 | +468 (+0.7%) | 1.7% | 2.9% |
| 200 or more employees | 5,366 | +44 (+0.8%) | 1.0% | 2.3% |
Total employing is an aggregate of the four employee bands shown below it. Do not add that row to the bands. Employment-size entries, exits and net changes can also be affected by businesses moving between size categories. Review ABS Data Cube 1, Tables 13 and 14 before using these figures for detailed modelling.
Digital activity across Australian businesses
A separate ABS survey for 2024-25 shows a gap between having an online presence and measuring digital performance. Social media use was common, but only 7% of businesses measured how digital activity contributed to overall business performance.
Used social media for an online presence
ABS, 2024-25
Received orders online
ABS, 2024-25
Used ICT to improve responsiveness to customer needs
ABS, 2024-25
Used ICT to improve sales or marketing methods
ABS, 2024-25
Used artificial intelligence
ABS, 2024-25
Actively collected or analysed data to make decisions
ABS, 2024-25
Measured digital activity contribution to performance
ABS, 2024-25
These rounded headline values come from a separate survey and do not form part of the business-count dataset. The dedicated report preserves exact workbook estimates, employment-size populations, historical comparison precision and reuse limitations.
Explore Australian business digital measurement statisticsSource and attribution
Based on Australian Bureau of Statistics data. SEO Guys selected, normalised and explained the figures for market-planning use. The ABS did not produce or endorse this analysis.
Editor and publisher reuse
Reuse a source-labelled graphic
Each SVG keeps its source, geography, reference period and material limitation visible. Copy the accessible HTML or download the original file, then check the report notes before publication.
Graphic 01
accessible capital-city comparison SVG
Graphic 02
accessible state and territory business growth SVG
Prefer a plain report citation?
Copy the report title, update date, page URL and source credit as one plain-text reference.
Use is optional. Editors may cite the original government source, change or remove the supplied link, and make their own attribution and link-treatment decisions. The copied code does not require a followed link or a keyword-rich anchor.
How to read the Australian business statistics
The headline count covers actively trading businesses in the Australian market sector. It is different from the number of entities holding an Australian Business Number. The ABS identifies activity using its Business Register and administrative data rather than treating every registration as an operating business.
Entries and exits describe movement into and out of the actively trading population. Net change is not always a simple subtraction at detailed levels because businesses can survive while moving between states, industries or employment-size categories. The downloadable file preserves the published start count, entry count, exit count, end count, net change and rates so the measures remain auditable.
Operating at end
The actively trading business count at 30 June 2026 for the selected geography, industry or employment-size category.
Net change
The change between the opening and closing business counts after entries, exits and relevant surviving-business movements.
Entry rate
Total entries during the financial year as a percentage of the opening business population.
Exit rate
Total exits during the financial year as a percentage of the opening business population.
What the data can support in market planning
Business counts can help size a broad market, compare growth patterns and challenge assumptions about a region or industry. They are useful context for content planning, service-area decisions, research briefs, media coverage and commercial strategy.
They cannot establish keyword demand, customer intent, achievable rankings or the value of one search visitor. Before investing, combine the population data with Search Console evidence, current search results, customer records, conversion rates, delivery capacity and a clearly assigned destination page.
- Use the state table to compare broad growth before researching specific city and regional catchments.
- Use industry counts to identify sectors worth investigating, not to assume every business is an addressable customer.
- Use employment-size data to test whether an offer and buying process fit the businesses in the market.
- Use digital activity statistics to frame adoption gaps without claiming that one channel caused a business outcome.
- Validate every market hypothesis with search demand, result-page competition and genuine service capacity.
- Keep the source release, reference period and extraction date beside any reused figure.
Methodology and limitations
The core report uses ABS Data Cube 1, Tables 1, 4, 13 and 14 from the release published on 18 August 2026. The source is the Australian Bureau of Statistics Business Register, supported by administrative data for ABN registrations in the Australian Business Register and business data from the Australian Taxation Office.
The scope includes actively trading businesses in the Australian market sector. It excludes the Reserve Bank of Australia, general government and non-profit institutions serving households. Geography in the August release is available for Australia, states and territories. More detailed data cubes are scheduled separately by the ABS and are not inferred in this report.
Detailed ABS data can be confidentialized and category movements can affect whether rows add exactly as a reader expects. State rows in this report exclude the ABS category for other territories or currently unknown. Digital activity figures come from the separate Characteristics of Australian Business 2024-25 release and should not be combined with the business-count population as though both releases used one identical measure.
How the capital-city comparison is scoped
The capital-city table uses eight Greater Capital City Statistical Areas from ASGS Edition 3. Each row uses the published 30 June 2025 business count and estimated resident population for the same metropolitan geography. Rows are alphabetical and do not represent a market ranking.
Gold Coast is shown in a separate regional panel because the available business profile uses Local Government Area 33430. An LGA and a Greater Capital City Statistical Area are different geography levels, so Gold Coast is not treated as a ninth comparable capital-city row.
Businesses per 1,000 residents is an SEO Guys calculation using the two published 2025 values. Business counts and population context do not measure premises, jobs, profitability, search demand, ranking difficulty, customer intent or likely enquiries.
How to cite, reuse and update the report
When quoting an unchanged official figure, cite the Australian Bureau of Statistics release directly. When using the normalized CSV, charts or explanations prepared here, describe the work as based on Australian Bureau of Statistics data and link both this report and the primary release.
A practical citation is: SEO Guys, Australian Business Statistics and Growth Report 2026, based on Australian Bureau of Statistics data, followed by this page URL and your access date. Do not imply that the ABS produced, reviewed or endorsed the SEO Guys analysis.
The normalized dataset is available under the Creative Commons Attribution 4.0 International licence. Keep the stated ABS attribution and link to the primary release when you reuse it.
The report will be reviewed when the ABS publishes a new annual Counts of Australian Businesses release or materially revises the current release. The updated date at the top of the page identifies the latest SEO Guys review.
Sources and further reading
Primary and authoritative sources used to support the factual guidance in this resource.
- Source 01ABS Counts of Australian Businesses, July 2022 - June 2026, opens in a new tabPrimary release for actively trading business counts, entries, exits, state results, industry results and employment-size results.
- Source 02ABS Counts of Australian Businesses methodology, opens in a new tabOfficial definitions, scope, sources, processing, classifications, quality information and history of changes.
- Source 03ABS Characteristics of Australian Business, 2024-25, opens in a new tabPrimary release for social media, online orders, ICT outcomes, data use, digital measurement and artificial intelligence adoption.
- Source 04ABS website copyright and Creative Commons terms, opens in a new tabOfficial licensing and attribution terms for material published by the Australian Bureau of Statistics.
- Source 05ABS Data by Region methodology, 2011 to 2025, opens in a new tabDefinitions, sources, geography handling and quality notes for the detailed regional business profiles used in the capital-city comparison.
- Source 06ABS Regional population, 2024 to 2025, opens in a new tabPrimary source for estimated resident population in the eight Greater Capital City Statistical Areas.
- Source 07ABS Greater Capital City Statistical Areas, Edition 3, opens in a new tabOfficial definition and boundaries for the common capital-city geography used by the eight comparison rows.