
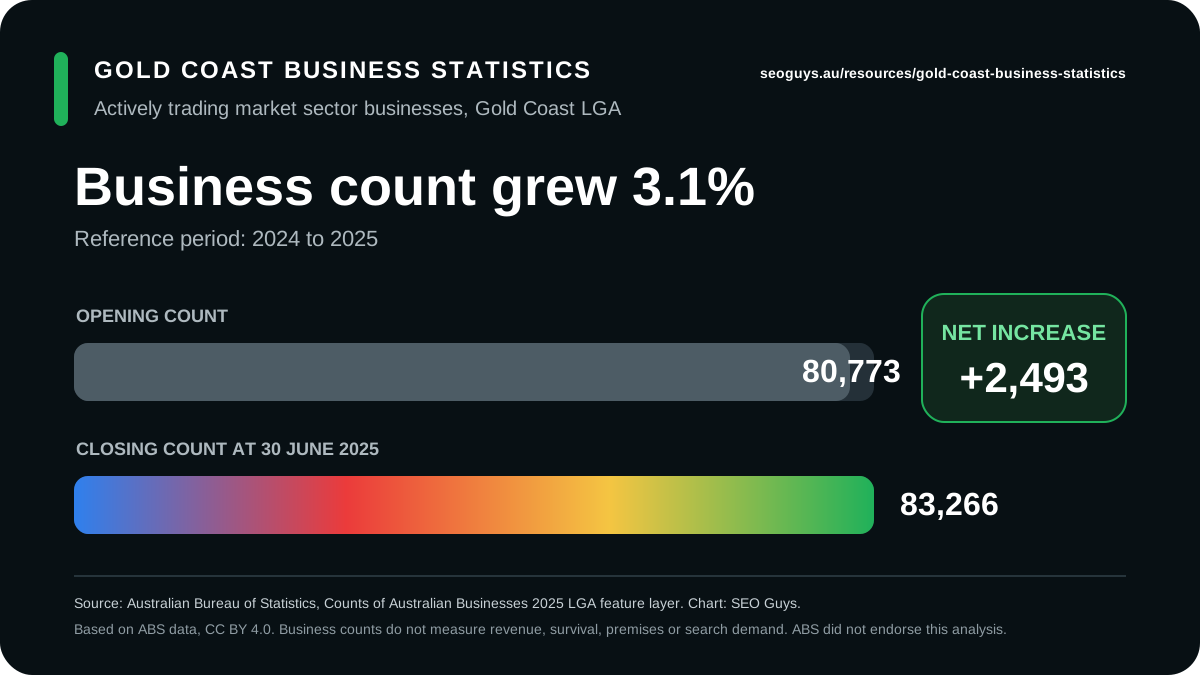
The Gold Coast had 83,266 actively trading market sector businesses at 30 June 2025. The count increased by 2,493, or 3.1%, during the 2024 to 2025 reporting period. This report brings that local business evidence together with population, employment size, turnover and industry data.
The detailed tables use Australian Bureau of Statistics data presented through the Queensland Government Statistician's Office. A local atlas adds the 53 complete Statistical Area Level 2 records allocated to the Gold Coast LGA. Current economic indicators are attributed separately to Invest Gold Coast so readers can see which source, period and geography supports each claim.
SEO Guys prepared the report for business owners, local organisations, journalists, researchers and market planners. It can frame a Gold Coast market question, but it does not measure search demand, website quality, customer intent or the number of businesses that need SEO.
Reusable local business dataset
Download the source-labelled Gold Coast business data
Use the normalized LGA CSV with its reference periods, geography, source URLs and limitations. A separate 53-area CSV is available inside the report. Retain the cited sources and do not present the figures as search demand.
Source-backed Gold Coast report
Gold Coast business growth at a glance
The Gold Coast had 83,266 actively trading market sector businesses at 30 June 2025. The count increased by 2,493, or 3.1%, during the 2024 to 2025 reporting period.
Active market sector businesses
83,266
At 30 June 2025
Net annual business growth
+2,493
+3.1%
Estimated resident population
691,230
Preliminary at 30 June 2025
Businesses per 1,000 residents
120.5
SEO Guys derived estimate
What the count means: the ABS measure covers actively trading businesses in the Australian market sector. It is not a count of every ABN, shopfront, website or business that needs SEO. Multi-location businesses can be assigned to one area, and the population estimate is preliminary.
Business size by employee count
Non-employing businesses represented 62.9% of the Gold Coast total. Another 26.0% employed one to four people. These bands describe business structure, not the number of people working in the region.
| Employment size | Businesses | Share |
|---|---|---|
| Non-employing | 52,343 | 62.9% |
| 1 to 4 employees | 21,663 | 26.0% |
| 5 to 19 employees | 7,072 | 8.5% |
| 20 to 199 employees | 2,098 | 2.5% |
| 200 or more employees | 90 | 0.1% |
Business size by annual turnover
The profile recorded 44,846 businesses with turnover below $200,000 and 35,626 from $200,000 to under $5 million. Turnover bands help describe the market, but they do not identify the revenue, budget or search demand of an individual business.
| Annual turnover range | Businesses | Share |
|---|---|---|
| $0 to under $200,000 | 44,846 | 53.9% |
| $200,000 to under $5 million | 35,626 | 42.8% |
| $5 million to under $10 million | 1,493 | 1.8% |
| $10 million or more | 1,301 | 1.6% |
Industry structure by business count
Construction was the leading industry with 15,355 businesses, followed by rental, hiring and real estate services and professional, scientific and technical services. This is a business count comparison. It does not rank industries by employment, output, revenue or SEO opportunity.
| Industry | Businesses | Share |
|---|---|---|
| Construction | 15,355 | 18.4% |
| Rental, hiring and real estate services | 12,135 | 14.6% |
| Professional, scientific and technical services | 11,181 | 13.4% |
| Health care and social assistance | 6,713 | 8.1% |
| Transport, postal and warehousing | 5,633 | 6.8% |
| Retail trade | 5,079 | 6.1% |
| Financial and insurance services | 4,450 | 5.3% |
| Other services | 4,414 | 5.3% |
| Administrative and support services | 4,150 | 5.0% |
| Accommodation and food services | 3,242 | 3.9% |
| Manufacturing | 3,156 | 3.8% |
| Wholesale trade | 2,658 | 3.2% |
| Arts and recreation services | 1,489 | 1.8% |
| Education and training | 1,345 | 1.6% |
| Information media and telecommunications | 934 | 1.1% |
| Agriculture, forestry and fishing | 678 | 0.8% |
| Public administration and safety | 259 | 0.3% |
| Electricity, gas, water and waste services | 223 | 0.3% |
| Mining | 133 | 0.2% |
| Not classified | 39 | 0.0% |
Local area atlas
Business counts across 53 Gold Coast statistical areas
ABS allocation files identify 53 complete Statistical Area Level 2 records inside the Gold Coast LGA. These areas are designed to represent communities that interact socially and economically. They are not suburb, postcode or service-area boundaries.
SA2 records
53
Gold Coast LGA code 33430
Combined end count
83,348
At 30 June 2025
Combined net change
+2,257
During 2024 to 2025
Derived change
2.8%
Calculated from SA2 totals
Do not force the totals to match: the 53 SA2 records sum to 83,348, which is 82 above the official LGA count of 83,266. ABS small-area cells can be confidentialised and data compiled for different geographies may not add exactly. The official LGA value remains the headline city total.
Ten largest local-area business counts
- Southport - North4,503
- Mermaid Beach - Broadbeach3,072
- Burleigh Heads3,063
- Hope Island2,679
- Helensvale2,600
- Nerang - Mount Nathan2,523
- Surfers Paradise - North2,481
- Southport - South2,397
- Bundall2,166
- Mudgeeraba - Bonogin2,139
Reusable local-area data
Download all 53 SA2 records
The CSV includes SA3 and SA2 codes, business and population change, leading industry, a derived business rate, sources, period and geography warnings.
Editor-ready chart
Reuse the business growth summary
The accessible SVG includes the reference period, ABS source, attribution and an explicit warning that business-count growth is not search demand.
View all 53 local statistical areas
| Statistical area | Businesses | Annual change | Leading industry |
|---|---|---|---|
| Broadbeach WatersSA2 309011224 | 1,419 | +23 (1.6%) | Rental, Hiring and Real Estate Services |
| Burleigh HeadsSA2 309011225 | 3,063 | +48 (1.6%) | Construction |
| Burleigh WatersSA2 309011226 | 1,781 | +79 (4.6%) | Construction |
| Mermaid Beach - BroadbeachSA2 309011227 | 3,072 | +90 (3.0%) | Rental, Hiring and Real Estate Services |
| Mermaid WatersSA2 309011228 | 1,673 | +24 (1.5%) | Construction |
| MiamiSA2 309011229 | 1,170 | +15 (1.3%) | Construction |
| CoolangattaSA2 309021230 | 957 | +45 (4.9%) | Rental, Hiring and Real Estate Services |
| Currumbin - TugunSA2 309021231 | 1,508 | +26 (1.8%) | Construction |
| Currumbin WatersSA2 309021232 | 1,253 | +19 (1.5%) | Construction |
| ElanoraSA2 309021233 | 1,045 | +21 (2.1%) | Construction |
| Palm BeachSA2 309021234 | 2,037 | +73 (3.7%) | Construction |
| ArundelSA2 309031235 | 1,684 | +21 (1.3%) | Construction |
| Biggera WatersSA2 309031236 | 1,150 | +37 (3.3%) | Construction |
| CoombabahSA2 309031237 | 671 | +37 (5.8%) | Construction |
| LabradorSA2 309031238 | 1,355 | +10 (0.7%) | Construction |
| Paradise Point - HollywellSA2 309031239 | 1,671 | +9 (0.5%) | Construction |
| Runaway BaySA2 309031240 | 1,200 | -5 (-0.4%) | Construction |
| Guanaba - SpringbrookSA2 309041241 | 588 | +9 (1.6%) | Construction |
| Currumbin Valley - TallebudgeraSA2 309051243 | 1,122 | +10 (0.9%) | Construction |
| Mudgeeraba - BonoginSA2 309051244 | 2,139 | +25 (1.2%) | Construction |
| Reedy Creek - AndrewsSA2 309051245 | 844 | +15 (1.8%) | Construction |
| CarraraSA2 309061246 | 1,633 | +43 (2.7%) | Construction |
| Highland ParkSA2 309061247 | 630 | -9 (-1.4%) | Construction |
| Nerang - Mount NathanSA2 309061248 | 2,523 | +35 (1.4%) | Construction |
| Pacific Pines - GavenSA2 309061249 | 1,447 | +16 (1.1%) | Construction |
| Worongary - TallaiSA2 309061250 | 1,254 | +17 (1.4%) | Construction |
| CoomeraSA2 309071251 | 1,942 | +60 (3.2%) | Construction |
| HelensvaleSA2 309071252 | 2,600 | +123 (5.0%) | Construction |
| Hope IslandSA2 309071253 | 2,679 | +87 (3.4%) | Rental, Hiring and Real Estate Services |
| Jacobs Well - AlbertonSA2 309071254 | 716 | +37 (5.4%) | Construction |
| Oxenford - MaudslandSA2 309071256 | 1,643 | +51 (3.2%) | Construction |
| Ormeau (East) - StapyltonSA2 309071552 | 1,382 | +58 (4.4%) | Construction |
| Ormeau (West) - YatalaSA2 309071553 | 2,005 | +89 (4.6%) | Construction |
| Pimpama - NorthSA2 309071554 | 1,032 | +60 (6.2%) | Transport, Postal and Warehousing |
| Pimpama - SouthSA2 309071555 | 724 | +66 (10.0%) | Transport, Postal and Warehousing |
| Upper Coomera (South) - WongawallanSA2 309071556 | 1,084 | +20 (1.9%) | Construction |
| Upper Coomera - NorthSA2 309071557 | 1,736 | +102 (6.2%) | Construction |
| Willow Vale - Pimpama (West)SA2 309071558 | 655 | +26 (4.1%) | Construction |
| Clear Island WatersSA2 309081259 | 677 | -1 (-0.1%) | Rental, Hiring and Real Estate Services |
| MerrimacSA2 309081260 | 507 | -6 (-1.2%) | Construction |
| Varsity LakesSA2 309081262 | 2,056 | +38 (1.9%) | Professional, Scientific and Technical Services |
| Robina - EastSA2 309081559 | 1,951 | +32 (1.7%) | Construction |
| Robina - WestSA2 309081560 | 1,252 | +26 (2.1%) | Professional, Scientific and Technical Services |
| AshmoreSA2 309091263 | 1,625 | +9 (0.6%) | Construction |
| MolendinarSA2 309091264 | 1,539 | +50 (3.4%) | Construction |
| ParkwoodSA2 309091265 | 806 | +17 (2.2%) | Construction |
| Southport - NorthSA2 309091540 | 4,503 | +232 (5.4%) | Rental, Hiring and Real Estate Services |
| Southport - SouthSA2 309091541 | 2,397 | +107 (4.7%) | Rental, Hiring and Real Estate Services |
| BenowaSA2 309101267 | 1,615 | +28 (1.8%) | Rental, Hiring and Real Estate Services |
| BundallSA2 309101268 | 2,166 | +71 (3.4%) | Rental, Hiring and Real Estate Services |
| Main BeachSA2 309101269 | 784 | +10 (1.3%) | Rental, Hiring and Real Estate Services |
| Surfers Paradise - NorthSA2 309101561 | 2,481 | +65 (2.7%) | Rental, Hiring and Real Estate Services |
| Surfers Paradise - SouthSA2 309101562 | 1,902 | +67 (3.7%) | Rental, Hiring and Real Estate Services |
Southport - North had the largest count at 4,503 and the largest absolute increase at 232. Pimpama - South recorded the highest percentage change at 10.0%, which represented 66 businesses. These changes describe business counts only. They do not establish local search volume, customer demand or the need for SEO in an area.
Current economic context from Invest Gold Coast
Invest Gold Coast reports a $55.2 billion Gross Regional Product for 2024 to 2025, with 25% growth since 2020 to 2021. Its 2026 State of the City release also reports more than 350,000 jobs supported and $19 billion in annual exports. These are attributed headline indicators and use a different reporting basis from the detailed LGA business tables above.
Gross Regional Product
$55.2b
2024 to 2025
Economic growth
25%
Since 2020 to 2021
Jobs supported
350,000+
State of the City 2026
Annual exports
$19b
State of the City 2026
Source and attribution
Business tables are based on Australian Bureau of Statistics data presented through the Queensland Government Statistician's Office. Population figures are sourced from Queensland Treasury. Economic indicators are attributed to Invest Gold Coast. SEO Guys calculated the businesses per 1,000 residents and explained the figures for market planning. The source organisations did not produce or endorse this analysis.
Editor and publisher reuse
Reuse a source-labelled graphic
Each SVG keeps its source, geography, reference period and material limitation visible. Copy the accessible HTML or download the original file, then check the report notes before publication.
Graphic 01
editor-ready Gold Coast business growth chart
Prefer a plain report citation?
Copy the report title, update date, page URL and source credit as one plain-text reference.
Use is optional. Editors may cite the original government source, change or remove the supplied link, and make their own attribution and link-treatment decisions. The copied code does not require a followed link or a keyword-rich anchor.
What changed in the Gold Coast business base
The ABS LGA record increased from 80,773 businesses at the beginning of the 2024 to 2025 reporting period to 83,266 at 30 June 2025. The net increase was 2,493 businesses, which reproduces the published growth rate of 3.1%.
The Gold Coast LGA population reached a preliminary 691,230 at the same reference date, an increase of 11,944 people. Dividing the business count by the population produces about 120.5 actively trading market sector businesses per 1,000 residents. That derived rate is a density measure, not a business survival, digital adoption or search demand measure.
Business count
83,266 actively trading market sector businesses at 30 June 2025, based on the ABS LGA record.
Annual business growth
A net increase of 2,493 businesses, or 3.1%, during the 2024 to 2025 reporting period.
Population
A preliminary estimated resident population of 691,230 at 30 June 2025, up 11,944 over the year.
Derived density
About 120.5 active market sector businesses per 1,000 residents, calculated by SEO Guys from the cited snapshots.
Read the market structure without overstating the result
Construction was the leading Gold Coast industry by business count. Rental, hiring and real estate services and professional, scientific and technical services were the next two largest divisions. This order describes the number of businesses, not their workforce, output, customer demand or value to the local economy.
The employment size and turnover tables show a market with many small operators. That can affect buying processes, service packaging and the evidence a supplier needs to communicate. It does not mean every small business shares one budget, problem or channel preference.
- Treat industry count as a research starting point rather than a keyword list.
- Separate non-employing operators from businesses with larger teams and buying committees.
- Use turnover bands to test offer fit, not to infer the budget of an individual organisation.
- Validate local customer language through interviews, enquiries and current search results.
- Check whether the business can serve the full Gold Coast LGA before targeting the whole market.
- Keep the reference date beside every reused figure.
Use the data to improve a Gold Coast market brief
Local data can make a strategy more specific when it helps define the audience, service area, commercial question and evidence gap. A construction supplier may use the industry table to frame partner research. A business association may use the size bands to plan member education. A journalist may use the net change as a lead that still needs reporting and expert context.
For SEO planning, combine the report with Search Console evidence, customer records, keyword research, current result pages and service capacity. The data can support a useful local resource or page, but it cannot prove that a query has demand or that a page can rank.
- Write the commercial question before selecting a statistic.
- Choose the exact Gold Coast customer group and service area the page can genuinely support.
- Map each search intent to one useful destination page instead of repeating city wording across the site.
- Add first-hand operating evidence, customer questions and responsible local sources.
- Use descriptive internal links from related services, resources, proof and location pages.
- Measure qualified enquiries and customer outcomes alongside impressions, rankings and clicks.
Methodology, geography and limitations
The business count covers actively trading businesses in the Australian market sector. It excludes general government, the Reserve Bank of Australia and non-profit institutions serving households. The ABS compiles the count from its Business Register and administrative data, then applies privacy and quality processes before publication.
A multi-location business is assigned to one geographic classification to avoid double counting, so the total is not a count of operating premises. LGA boundaries are statistical approximations and detailed categories can be confidentialised. The Gold Coast record was not marked as a suppressed area, but the broader methodology qualifications still apply.
Official ABS allocation files identify 53 complete SA2 records inside the Gold Coast LGA. Their published business rows sum to 83,348, which is 82 above the official LGA count. Detailed small-area cells can be non-additive, so the LGA value remains the headline total and the SA2 rows are presented as local statistical area records rather than a replacement city total.
The 2025 population estimate is preliminary. Invest Gold Coast economic indicators use a separate reporting basis from the detailed LGA tables and are attributed as published. Do not combine the sources as though they form one statistical series.
How to cite, reuse and update this report
When quoting an unchanged official figure, cite the original ABS, QGSO or Invest Gold Coast source. When using the selection, calculation or explanation prepared here, link this report as the analysis and retain the primary source beside the claim.
A practical citation is: SEO Guys, Gold Coast Business Statistics and Growth Report 2026, based on ABS and Queensland Government data, followed by this page URL and your access date. Do not imply that a source organisation produced, reviewed or endorsed the SEO Guys analysis.
The downloadable normalized dataset contains ABS and Queensland Government statistical material with source URLs recorded in the file and reuse terms cited on this page. SEO Guys' selection, arrangement and original explanations are offered under Creative Commons Attribution 4.0 where we have the right to do so.
Invest Gold Coast economic context is attributed separately on this page, is not included in the Creative Commons CSV and remains subject to Invest Gold Coast's own terms. Review every official source before republication and update the report only when a newer detailed LGA release or material source revision is available.
Sources and further reading
Primary and authoritative sources used to support the factual guidance in this resource.
- Source 01ABS Counts of Australian Businesses LGA feature layer, opens in a new tabOfficial LGA record for opening and closing business counts, net change, percentage change, suppression status and leading industry.
- Source 02ABS Counts of Australian Businesses SA2 feature layer, opens in a new tabOfficial local statistical area records for opening and closing business counts, net and percentage change, suppression status and leading industry.
- Source 03ABS ASGS allocation files, opens in a new tabOfficial Mesh Block and LGA allocation workbooks used to verify the 53 complete SA2 components of the Gold Coast LGA.
- Source 04ABS Regional Population SA2 feature layer, opens in a new tabOfficial 2024 and preliminary 2025 population records used in the downloadable local-area dataset and derived business-density measure.
- Source 05ABS Counts of Australian Businesses methodology, July 2021 to June 2025, opens in a new tabOfficial definitions, scope, sources, geography, confidentiality, quality information and reference dates.
- Source 06QGSO Gold Coast resident profile, opens in a new tabQueensland Government profile used for business employment size, turnover range and industry tables.
- Source 07QGSO population growth, regional Queensland, 2024 to 2025, opens in a new tabOfficial Gold Coast LGA population estimate, annual increase and population ranking, sourced from ABS Regional population.
- Source 08Invest Gold Coast State of the City 2026, opens in a new tabThe published report containing the attributed Gross Regional Product, economic growth, jobs supported and annual export indicators.
- Source 09Invest Gold Coast terms and conditions, opens in a new tabReuse terms for Invest Gold Coast material, which remains outside the Creative Commons dataset download.
- Source 10Creative Commons Attribution 4.0 International, opens in a new tabLicence offered for compatible open data and SEO Guys' original selection, arrangement and explanations where rights allow.
- Source 11ABS website copyright and Creative Commons terms, opens in a new tabOfficial ABS attribution and reuse terms for compatible website material.