
Greater Perth had 214,310 actively trading market sector businesses at 30 June 2025. That was 9,675 more than the 2024 count, a derived increase of 4.7%. The estimated resident population reached 2,452,765 at the same date, after growing by 58,088 people or 2.4% over the year.
This report uses Australian Bureau of Statistics Data by Region for the Greater Perth Greater Capital City Statistical Area, code 5GPER. It adds employment-size, turnover and industry tables, a normalized CSV and an original proportional graphic with the source, geography and limitations kept visible.
SEO Guys prepared the report for Perth business owners, local organisations, journalists, researchers and market planners. Population and business data can help frame a market question, but they do not prove search demand, customer intent, ranking difficulty or SEO opportunity.
Reusable local business dataset
Download the source-labelled Greater Perth business data
Use the normalized CSV with its geography code, reference periods, source URLs, licence and evidence limits. Retain the attribution and do not present the figures as search demand.
Source-backed Greater Perth report
Greater Perth business structure at a glance
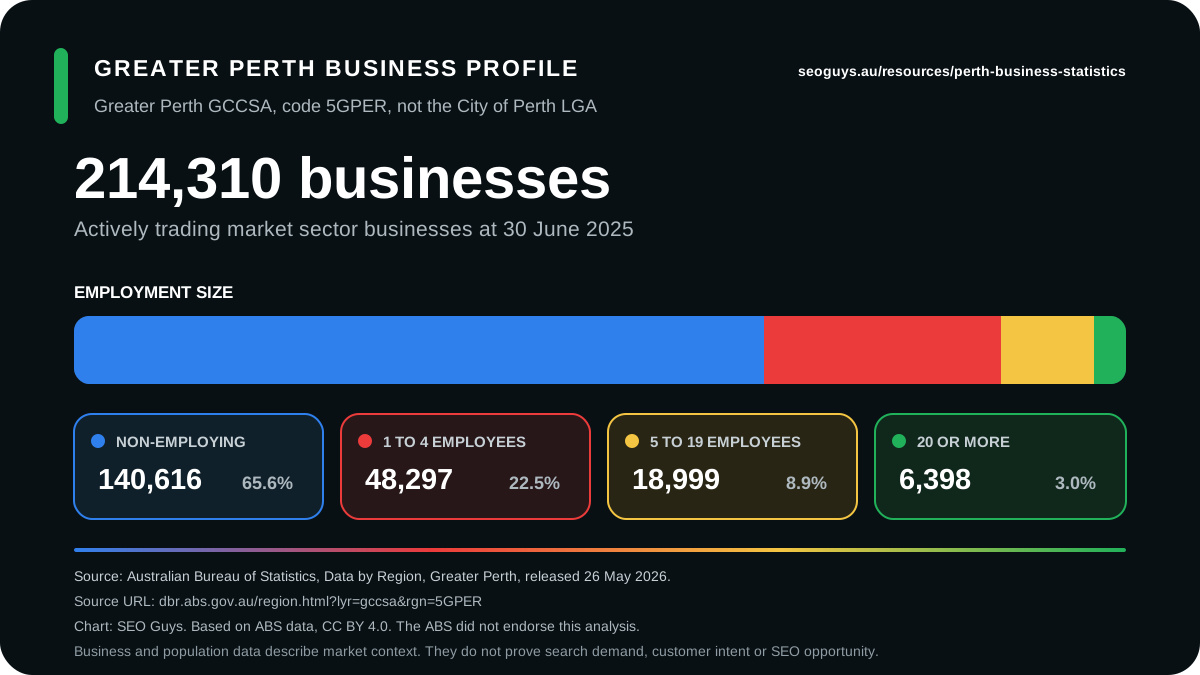
Greater Perth had 214,310 actively trading market sector businesses at 30 June 2025. The count was 9,675 higher than the 2024 count, a derived increase of 4.7%.
Active market sector businesses
214,310
At 30 June 2025
Increase from the 2024 count
+9,675
Derived 4.7% increase
Estimated resident population
2,452,765
At 30 June 2025
Annual population growth
+2.4%
+58,088 people
Evidence limit: population and business counts describe the Greater Perth market. They do not prove search demand, customer intent, ranking difficulty or the likely value of an SEO campaign.
Business size by employee count
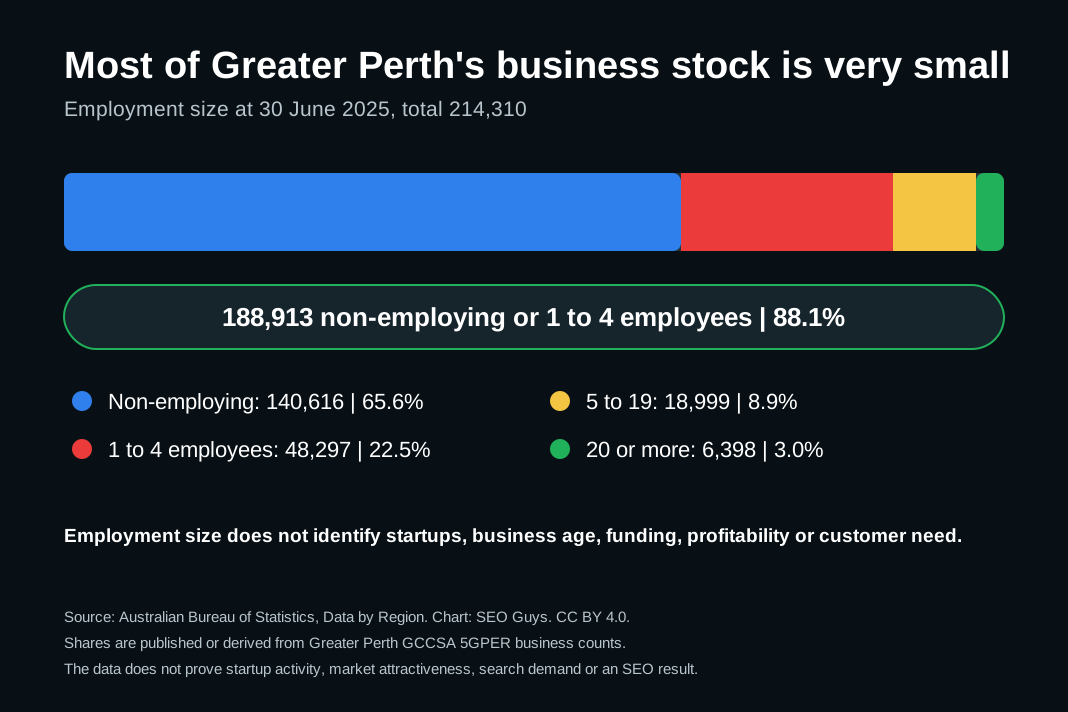
Non-employing businesses represented 65.6% of the Greater Perth total, while 22.5% employed one to four people. Together those two groups accounted for 188,913 businesses, or 88.1% of the published total. The bands describe business structure, not workforce size.
| Employment size | Businesses | Share |
|---|---|---|
| Non-employing | 140,616 | 65.6% |
| 1 to 4 employees | 48,297 | 22.5% |
| 5 to 19 employees | 18,999 | 8.9% |
| 20 or more employees | 6,398 | 3.0% |
Business size by annual turnover
The largest turnover band contained 73,633 businesses with $200,000 to under $2 million in annual turnover. Only 18,072, or 8.4%, were in the $2 million or more band. Turnover does not establish the budget, profitability or channel preference of an individual firm.
| Annual turnover range | Businesses | Share |
|---|---|---|
| Under $50,000 | 54,121 | 25.3% |
| $50,000 to under $200,000 | 68,484 | 32.0% |
| $200,000 to under $2 million | 73,633 | 34.4% |
| $2 million or more | 18,072 | 8.4% |
Five largest industries by business count
Construction had the largest 2025 business count. Transport, postal and warehousing grew fastest among the four rows with a verified 2021 comparison, increasing 42.9%. These are business-count changes, not rankings by revenue, employment or SEO opportunity.
| Industry | 2025 count | Share | Change since 2021 |
|---|---|---|---|
| Construction | 37,191 | 17.4% | +15.2% |
| Professional, scientific and technical services | 29,948 | 14.0% | +12.3% |
| Transport, postal and warehousing | 25,914 | 12.1% | +42.9% |
| Rental, hiring and real estate services | 23,706 | 11.1% | Not shown |
| Health care and social assistance | 17,062 | 8.0% | +32.0% |
Reusable source-labelled graphic
Download the Greater Perth business profile
The accessible SVG uses a proportional employment-size bar and includes the geography, period, ABS source, licence, attribution and evidence warning.
Source and attribution
Business tables are based on Australian Bureau of Statistics Data by Region for Greater Perth, GCCSA code 5GPER. Population is from ABS Regional population. SEO Guys selected, checked and explained the figures. The ABS did not produce or endorse this analysis.
Editor and publisher reuse
Reuse a source-labelled graphic
Each SVG keeps its source, geography, reference period and material limitation visible. Copy the accessible HTML or download the original file, then check the report notes before publication.
Graphic 01
editor-ready Greater Perth business profile chart
Graphic 02
Greater Perth annual business-stock chart
Graphic 03
Greater Perth employment-size chart
Prefer a plain report citation?
Copy the report title, update date, page URL and source credit as one plain-text reference.
Use is optional. Editors may cite the original government source, change or remove the supplied link, and make their own attribution and link-treatment decisions. The copied code does not require a followed link or a keyword-rich anchor.
What changed in the Greater Perth business base
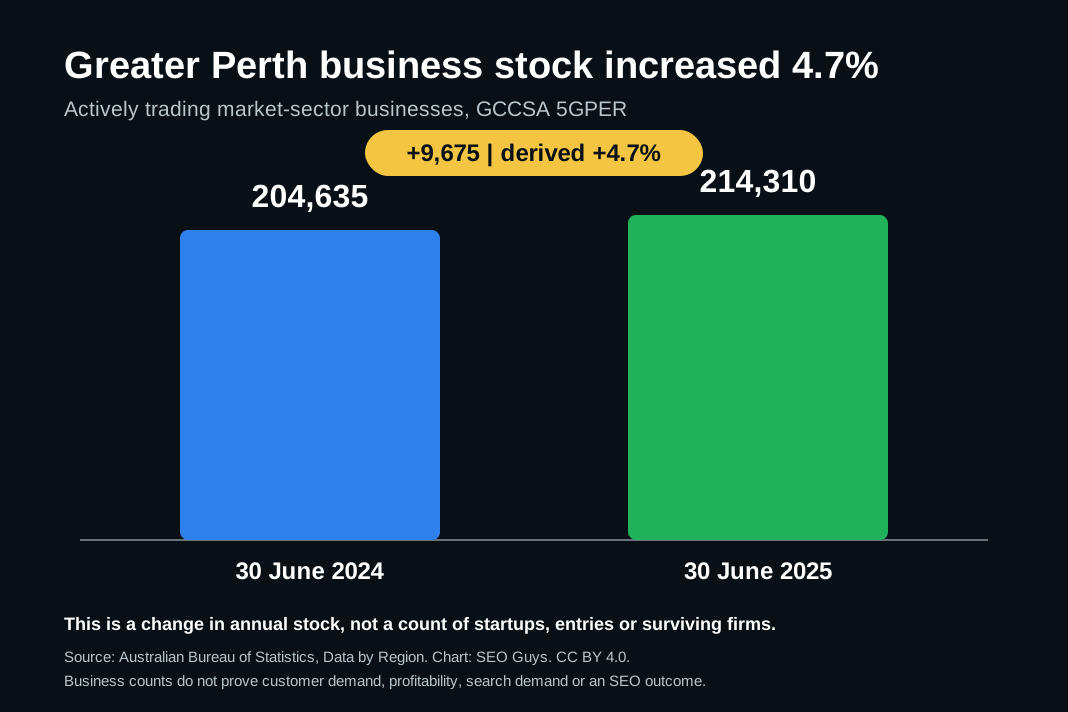
The ABS Data by Region count increased from 204,635 actively trading market sector businesses in 2024 to 214,310 at 30 June 2025. The difference is 9,675 businesses. Dividing that difference by the 2024 count produces a 4.7% increase after rounding to one decimal place.
Greater Perth's estimated resident population reached 2,452,765 at 30 June 2025, up 58,088 people or 2.4% over the year. The ABS reported Perth as the fastest-growing capital city by percentage in the 2024 to 2025 financial year. That population result describes demographic change, not online search behaviour.
Business count
214,310 actively trading market sector businesses at 30 June 2025 for Greater Perth, GCCSA code 5GPER.
Business count change
A derived increase of 9,675 businesses, or 4.7%, compared with the 2024 count of 204,635.
Population
An estimated resident population of 2,452,765 at 30 June 2025, up 58,088 people over the year.
Population growth
Annual growth of 2.4%, the highest percentage growth among Australian capital cities in the ABS release.
Read the business structure without overstating it
Non-employing businesses accounted for 140,616 of the Greater Perth total. Another 48,297 employed one to four people. Together, those two groups represented 188,913 businesses, or 88.1% of the published count after rounding.
Construction was the largest industry by business count at 37,191. Professional, scientific and technical services followed at 29,948, then transport, postal and warehousing at 25,914. The transport count was 42.9% higher than in 2021, but that comparison does not measure revenue, jobs or customer demand.
Annual turnover was below $2 million for 196,238 businesses, while 18,072 were in the $2 million or more band. These categories can support a broad market brief, but they cannot reveal an individual firm's budget, profitability or likelihood of buying SEO services.
- Use business-size data to question whether one offer and sales process can serve every buyer.
- Treat industry counts as a starting point for research rather than a keyword or outreach list.
- Keep Greater Perth separate from the City of Perth local government area in every reused claim.
- Keep the reference year beside every count and label derived changes as calculations.
- Validate a market idea with customers, search results and first-party data before acting on it.
Use the report to improve a Perth market brief
The report can help a Perth organisation describe the broad business base, compare company-size bands and identify an industry question worth investigating. A business association might use the employment table to plan education. A journalist might use the business-count change as a lead that still needs interviews and reporting.
For SEO planning, combine the statistics with Search Console evidence, keyword research, customer records, current result pages, conversion rates and genuine service capacity. Population and business data do not prove search demand. A large or growing category can still have weak intent, poor commercial fit or no realistic ranking path for a particular website.
- Write the commercial question before selecting a statistic.
- Choose the exact Perth audience and service area the business can genuinely support.
- Map each search intent to one useful destination rather than repeating city wording across the site.
- Add first-hand expertise, customer questions and responsible local sources.
- Measure qualified enquiries and customer outcomes alongside impressions, rankings and clicks.
Methodology, geography and limitations
The business data comes from the ABS Data by Region release updated on 26 May 2026. The report uses the published Greater Perth GCCSA record, code 5GPER, and the 2021 to 2025 time-series values included in the official CSV.
Counts of Australian businesses cover actively trading businesses in the Australian market sector. They are based on the ABS Business Register and administrative data. The measure is not a count of every ABN, shopfront, website or physical operating location.
Greater Capital City Statistical Areas are designed to represent the functional area of a capital city, including populations that regularly socialise, shop or work within it. Greater Perth is not the City of Perth local government area, and its boundary can differ from commonly used ideas of metropolitan Perth.
A multi-location business is assigned to one geography to avoid double counting. ABS regional data can also be revised, rounded, confidentialised or produced through geographic correspondences. Time periods, definitions and coverage differ between collections, so published totals should not be combined without checking their scope.
How to cite, reuse and update this report
When quoting an unchanged official figure, cite the Australian Bureau of Statistics source directly. When using the selection, derived calculations or explanations prepared here, link this report as the analysis and keep the primary source beside the claim.
A practical citation is: SEO Guys, Perth Business Statistics and Growth Report 2026, based on Australian Bureau of Statistics data, followed by this page URL and your access date. Do not imply that the ABS produced, reviewed or endorsed the SEO Guys analysis.
The normalized CSV and original SVG are offered under Creative Commons Attribution 4.0. Retain the stated ABS attribution, SEO Guys credit, source URL, geography, period and evidence warning. ABS logos, branding, microdata and third-party material are not included.
Review the report when the ABS publishes a new Data by Region release or materially revises the current figures. The updated date at the top of the page identifies the latest SEO Guys review.
Sources and further reading
Primary and authoritative sources used to support the factual guidance in this resource.
- Source 01ABS Data by Region, Greater Perth, opens in a new tabOfficial Greater Perth profile and downloads for population, business, industry and other regional measures.
- Source 02ABS Data by Region Greater Perth CSV, opens in a new tabOfficial machine-readable time series used for the 2021 to 2025 business counts, employment size, turnover and industry tables.
- Source 03ABS Data by Region methodology, 2011 to 2025, opens in a new tabOfficial release dates, geographic coverage, business definitions, source methods, revisions, correspondence and confidentiality cautions.
- Source 04ABS Regional population, 2024 to 2025, opens in a new tabOfficial Greater Perth estimated resident population, annual increase, growth rate and capital-city comparison released 31 March 2026.
- Source 05ABS Greater Capital City Statistical Areas, opens in a new tabOfficial definition and design criteria for the functional capital-city geography used in this report.
- Source 06ABS website copyright and Creative Commons terms, opens in a new tabOfficial CC BY 4.0 terms, attribution requirements and excluded ABS or third-party material.
- Source 07ABS guidance on citing sources, opens in a new tabOfficial guidance for identifying the ABS as author and recording release details when citing statistics.