
In this report, Canberra means the Australian Capital Territory Greater Capital City Statistical Area, code 8ACTE. It covers the whole ACT and excludes Queanbeyan, NSW.
The current ABS Main State series reports 37,785 actively trading market-sector businesses in the ACT at 30 June 2026, up 789 or 2.1% over the year.
The detailed Data by Region profile reports 36,934 businesses in GCCSA 8ACTE at 30 June 2025. Its employment, turnover and industry figures use that detailed denominator and are not combined with the current Main State total.
SEO Guys prepared this report for Canberra business owners, local organisations, journalists, researchers and market planners. Business and population data can frame a useful question, but they do not prove search demand, customer intent, ranking difficulty or SEO opportunity.
Reusable ACT and Canberra dataset
Download the source-labelled Canberra business data
Use the normalized CSV with its separate Main State and 8ACTE records, reference periods, formulas, source URLs and evidence limits. Retain the attribution and geography notes.
Source-backed Canberra report
Canberra business statistics at a glance
The detailed Australian Capital Territory GCCSA record reports 36,934 actively trading market-sector businesses at 30 June 2025, while the separate current Main State headline reaches 37,785 at 30 June 2026.
Geography note: The detailed profile uses GCCSA 8ACTE, which covers the whole Australian Capital Territory and excludes Queanbeyan, NSW. The separate current headline uses the ABS Main State classification.
Active market sector businesses
36,934
At 30 June 2025
Increase from the 2024 count
+697
Derived 1.9% increase
Estimated resident population
484,630
At 30 June 2025
Annual population growth
+1.3%
+6,200 people
Evidence limit: Business and population data do not prove search demand, customer intent, ranking difficulty or SEO opportunity.
Detailed business count from 2021 to 2025
Use the 8ACTE time series on its own denominator and keep it separate from the current Main State headline.
| Year | Proportional count bar | Businesses |
|---|---|---|
| 2021 | 31,405 | |
| 2022 | 33,693 | |
| 2023 | 34,997 | |
| 2024 | 36,237 | |
| 2025 | 36,934 |
Businesses by employment size
The employment-size bands reconcile to the detailed 2025 GCCSA total. Their shares describe business structure, not the number of workers in Canberra.
| Employment size | Businesses | Share |
|---|---|---|
| Non-employing | 21,564 | 58.4% |
| 1 to 4 employees | 10,683 | 28.9% |
| 5 to 19 employees | 3,586 | 9.7% |
| 20 or more employees | 1,101 | 3.0% |
Businesses by annual turnover
The turnover bands reconcile to the detailed 2025 GCCSA total. The measure is lagged and does not reveal profit or marketing budget.
| Annual turnover range | Businesses | Share |
|---|---|---|
| Under $50,000 | 8,978 | 24.3% |
| $50,000 to under $200,000 | 10,752 | 29.1% |
| $200,000 to under $2 million | 14,068 | 38.1% |
| $2 million or more | 3,136 | 8.5% |
Leading industries and selected count changes
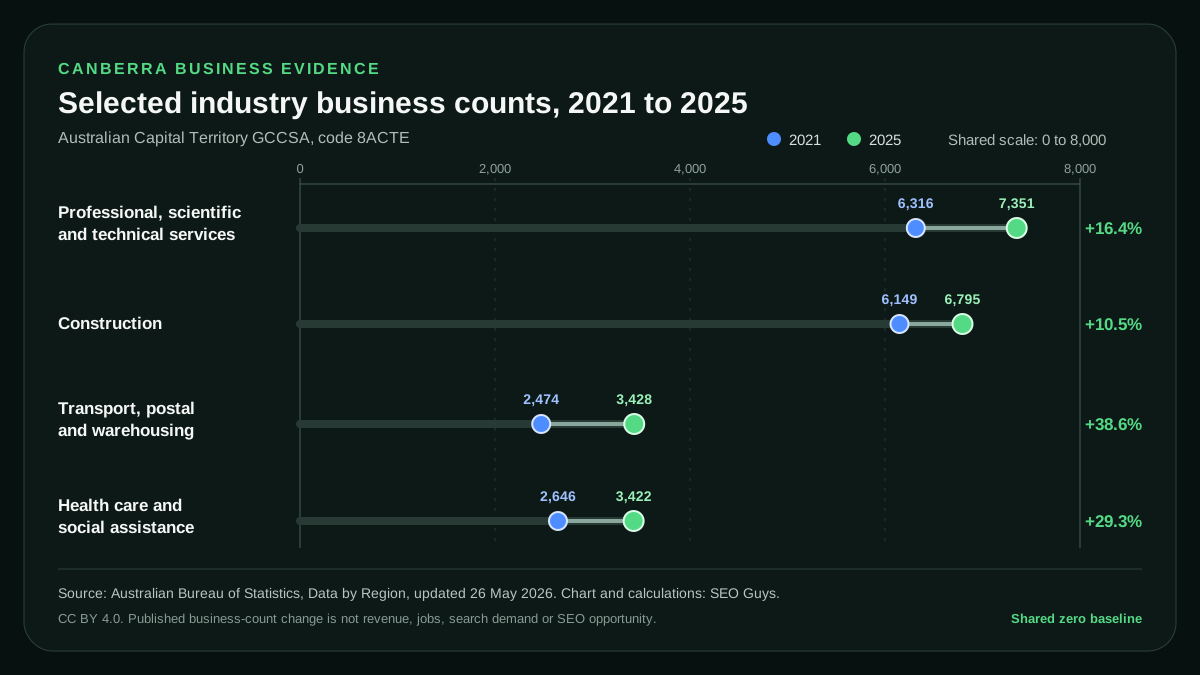
The industry table uses each business's assigned main ANZSIC activity. The selected time-series changes do not measure revenue or employment growth.
| Industry | 2025 count | Share | Change from 2021 |
|---|---|---|---|
| Professional, scientific and technical services | 7,351 | 19.9% | +16.4% |
| Construction | 6,795 | 18.4% | +10.5% |
| Rental, hiring and real estate services | 3,635 | 9.8% | Not shown |
| Transport, postal and warehousing | 3,428 | 9.3% | +38.6% |
| Health care and social assistance | 3,422 | 9.3% | +29.3% |
Editor-ready chart
Selected Canberra industry business counts
Download the accessible zero-baseline comparison of four selected industries in 2021 and 2025.
Source and attribution
Sources are the Australian Bureau of Statistics Counts of Australian Businesses, Data by Region and Regional population releases.
Editor and publisher reuse
Reuse a source-labelled graphic
Each SVG keeps its source, geography, reference period and material limitation visible. Copy the accessible HTML or download the original file, then check the report notes before publication.
Graphic 01
selected Canberra industry change chart
Prefer a plain report citation?
Copy the report title, update date, page URL and source credit as one plain-text reference.
Use is optional. Editors may cite the original government source, change or remove the supplied link, and make their own attribution and link-treatment decisions. The copied code does not require a followed link or a keyword-rich anchor.
Canberra reached 484,630 residents at 30 June 2025
The estimated resident population for the whole ACT reached 484,630 at 30 June 2025, up 6,200 people or 1.3% over the year.
Natural increase contributed 2,882 people and net overseas migration contributed 4,819, while net internal migration was negative 1,501. Those three components reconcile to the published annual increase.
Evidence limit: Population and migration describe demographic change. They do not prove search demand, customer intent, ranking difficulty or SEO opportunity.
Keep ACT, Canberra - Queanbeyan and local areas distinct
GCCSA 8ACTE covers the entire Australian Capital Territory and excludes Queanbeyan, NSW. The separate Canberra - Queanbeyan Significant Urban Area crosses the territory border and should not inherit ACT-only figures.
The ABS LGA structure labels the territory Unincorporated ACT, code LGA89399. That is a statistical category, not a City of Canberra council. Statistical Areas Level 2 are also analytical regions and should not automatically be treated as exact suburb or service-area boundaries.
Evidence limit: Use the exact geography name and code beside every reused statistic.
Use the evidence to frame questions, then validate them
A business association can use the employment profile to plan member education. A journalist can use the current count as a lead that still needs interviews and reporting. A business can use the industry table to identify a market question worth testing.
For SEO planning, combine the statistics with Search Console evidence, customer records, current search results, conversion data and genuine service capacity. A large category can still have weak intent, poor commercial fit or no realistic ranking path for a particular website.
How the figures were selected and calculated
The current 2026 headline comes from the ABS Main State table released on 18 August 2026. The employment, turnover and industry detail comes from the 8ACTE Data by Region CSV updated on 26 May 2026. The population context comes from Regional population released on 31 March 2026.
Derived figures are labelled and their formulas are stored with the dataset. Business counts cover actively trading businesses in the market sector. They are based on the ABS Business Register and administrative data, and exclude several institutional and industry categories described by the ABS.
Multi-location businesses are assigned to one geography to prevent double counting. Regional values can be confidentialised, revised or produced using geographic correspondences. The current Main State and detailed GCCSA denominators must remain separate.
Retain the source, geography, period and limitations
When quoting an unchanged official figure, cite the Australian Bureau of Statistics directly. When using the selection, calculations or explanations prepared here, link this report as the analysis and keep the official source beside the claim.
A practical citation is: SEO Guys, Canberra Business Statistics and Growth Report 2026, based on Australian Bureau of Statistics data, followed by the page URL and access date. Do not imply that the ABS produced, reviewed or endorsed the SEO Guys analysis.
The normalized CSV and original SVG are offered under Creative Commons Attribution 4.0. Retain the ABS attribution, SEO Guys credit, source URLs, geography, periods and evidence warnings. ABS logos, branding, microdata and third-party material are not included.
Sources and further reading
Primary and authoritative sources used to support the factual guidance in this resource.
- Source 01ABS Counts of Australian Businesses, July 2022 to June 2026, opens in a new tabCurrent Australian Capital Territory Main State business count, annual change, entries and exits in Data cube 1, Table 4.
- Source 02ABS Counts of Australian Businesses Data cube 1, opens in a new tabOfficial workbook containing the 2025 and 2026 Australian Capital Territory Main State values used for the current headline.
- Source 03ABS Counts of Australian Businesses methodology, July 2022 to June 2026, opens in a new tabOfficial scope, Main State assignment, multi-location, business activity and time-series methods for the current headline.
- Source 04ABS Data by Region, Australian Capital Territory GCCSA, opens in a new tabOfficial profile for the Australian Capital Territory Greater Capital City Statistical Area, code 8ACTE.
- Source 05ABS Data by Region Australian Capital Territory CSV, opens in a new tabOfficial machine-readable 2021 to 2025 business counts, employment size, turnover and industry time series.
- Source 06ABS Data by Region methodology, 2011 to 2025, opens in a new tabOfficial definitions, geography, revisions, correspondence, confidentiality and business-count limitations.
- Source 07ABS Regional population, 2024 to 2025, opens in a new tabOfficial Canberra capital-city population, population change and migration components for the whole ACT.
- Source 08ABS Greater Capital City Statistical Areas, opens in a new tabOfficial definition confirming that the Australian Capital Territory has one GCCSA covering the entire Territory.
- Source 09ABS Significant Urban Areas, opens in a new tabOfficial definition of the separate Canberra - Queanbeyan cross-border Significant Urban Area.
- Source 10ABS Local Government Areas, opens in a new tabOfficial explanation that the ACT is represented as Unincorporated ACT in the ABS LGA structure rather than as a municipal council.
- Source 11ABS website copyright and Creative Commons terms, opens in a new tabOfficial CC BY 4.0 terms, required attribution and exclusions for ABS logos, branding, microdata and third-party material.