
Greater Melbourne had 596,547 actively trading market-sector businesses at 30 June 2025. That was 14,730 more than the 2024 snapshot, a derived increase of 2.5%.
The total increase came with a mixed employment-size pattern. Non-employing businesses increased by 17,935, while the three employing bands declined by a combined 3,205. The four-LGA inset also shows materially different annual business count changes across Melbourne, Hume, Melton and Wyndham.
SEO Guys prepared this independent report from Australian Bureau of Statistics Data by Region and Regional population releases. The ABS did not produce or endorse the analysis. Business counts do not establish search demand, customer intent, ranking difficulty or likely SEO results.
Reusable local business dataset
Download the source-labelled Greater Melbourne business data
Use the normalized CSV with its geography codes, reference periods, source URLs, calculation labels, licence and evidence limits. Retain the attribution when reusing it.
Source-backed Greater Melbourne report
Greater Melbourne business structure at a glance
Greater Melbourne had 596,547 actively trading market-sector businesses at 30 June 2025. The count was 14,730 higher than in 2024, a derived increase of 2.5%.
Geography note: Greater Melbourne GCCSA is the functional capital city region defined by the ABS. It is not the Melbourne local government area. It is not Melbourne CBD, a suburb, a growth corridor or the whole of Victoria.
Active market sector businesses
596,547
At 30 June 2025
Increase from the 2024 count
+14,730
Derived 2.5% increase
Estimated resident population
5,435,590
At 30 June 2025
Annual population growth
+2.0%
+105,030 people
Evidence limit: Business and population statistics can frame a market question. They do not prove search demand, customer intent, ranking difficulty, marketing budgets or SEO opportunity.
Five-year Greater Melbourne business count
The published count changed from 512,391 in 2021 to 596,547 in 2025, an end-point increase of 84,156 or 16.4%. Historical values may be revised between ABS releases.
| Year | Proportional count bar | Businesses |
|---|---|---|
| 2021 | 512,391 | |
| 2022 | 561,900 | |
| 2023 | 564,899 | |
| 2024 | 581,817 | |
| 2025 | 596,547 |
Business structure by employment size
Non-employing businesses and businesses with 1 to 4 employees accounted for 538,791 of the Greater Melbourne total, or 90.3%. These bands describe business structure, not workforce size or buying intent.
| Employment size | Businesses | Share |
|---|---|---|
| Non-employing | 404,608 | 67.8% |
| 1 to 4 employees | 134,183 | 22.5% |
| 5 to 19 employees | 43,543 | 7.3% |
| 20 or more employees | 14,213 | 2.4% |
Business structure by annual turnover
The two turnover bands at $200,000 or more contained 239,384 businesses, or 40.1% of the total. Turnover does not reveal profit, marketing budget or channel preference.
| Annual turnover range | Businesses | Share |
|---|---|---|
| Zero to under $50,000 | 159,790 | 26.8% |
| $50,000 to under $200,000 | 197,373 | 33.1% |
| $200,000 to under $2 million | 192,283 | 32.2% |
| $2 million or more | 47,101 | 7.9% |
Largest industries by business count
The five largest published industry divisions accounted for 368,212 businesses, or 61.7% of the total. Each business is assigned one main ANZSIC industry, and these counts do not measure jobs or revenue.
| Industry | 2025 count | Share | Change from 2021 |
|---|---|---|---|
| Construction | 98,687 | 16.5% | +11.9% |
| Professional, scientific and technical services | 82,163 | 13.8% | +11.9% |
| Transport, postal and warehousing | 72,804 | 12.2% | +40.7% |
| Rental, hiring and real estate services | 67,721 | 11.4% | +15.7% |
| Health care and social assistance | 46,837 | 7.9% | +35.2% |
| Retail trade | 38,370 | 6.4% | +5.0% |
| Financial and insurance services | 32,957 | 5.5% | +19.5% |
| Administrative and support services | 30,608 | 5.1% | +19.6% |
Reusable same-level local comparison
Compare annual business count change across four LGAs
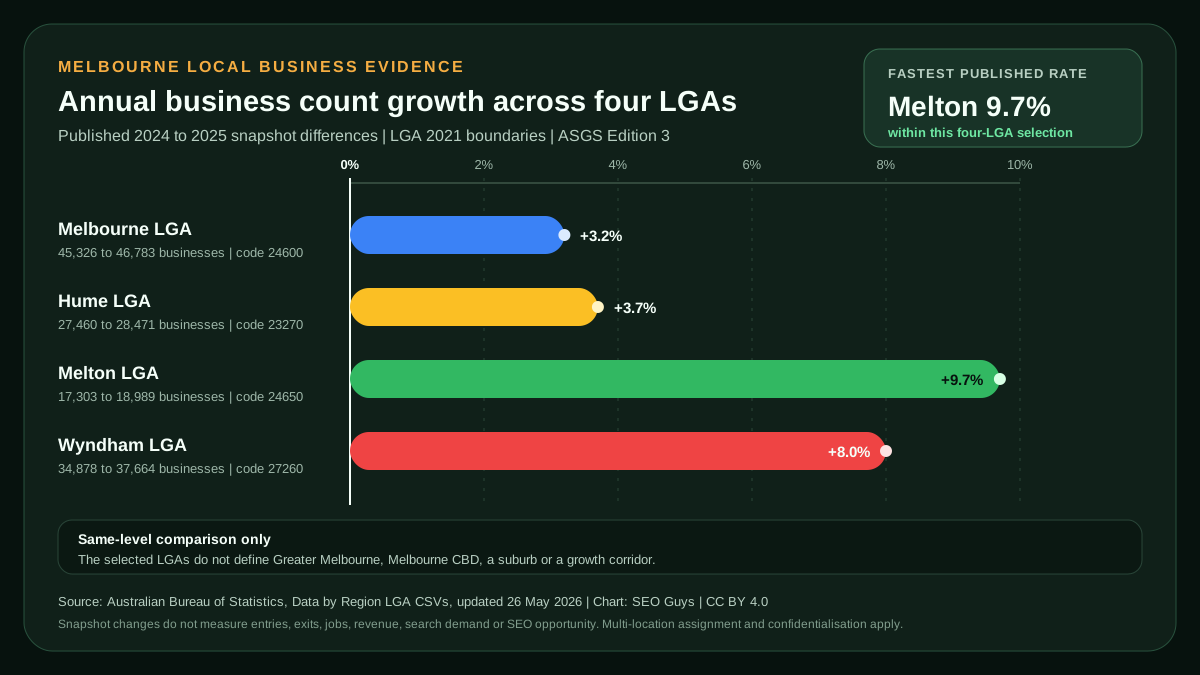
The accessible SVG compares Melbourne, Hume, Melton and Wyndham on one zero-based percentage scale and keeps the geography, source, licence and evidence warning visible.
Source and attribution
Business and population tables use Australian Bureau of Statistics Data by Region for Greater Melbourne, GCCSA code 2GMEL. The local inset uses Melbourne, Hume, Melton and Wyndham LGAs on the same LGA 2021 boundary reference. SEO Guys selected, checked and explained the figures. The ABS did not produce or endorse this analysis.
Editor and publisher reuse
Reuse a source-labelled graphic
Each SVG keeps its source, geography, reference period and material limitation visible. Copy the accessible HTML or download the original file, then check the report notes before publication.
Graphic 01
editor-ready Melbourne LGA business growth chart
Prefer a plain report citation?
Copy the report title, update date, page URL and source credit as one plain-text reference.
Use is optional. Editors may cite the original government source, change or remove the supplied link, and make their own attribution and link-treatment decisions. The copied code does not require a followed link or a keyword-rich anchor.
Read the business growth and employment structure together
The published Greater Melbourne business count changed from 581,817 in 2024 to 596,547 in 2025. The derived increase was 14,730 businesses or 2.5%. Across the longer 2021 to 2025 comparison, the count increased by 84,156 or 16.4%.
Non-employing businesses increased by 17,935 between the two latest snapshots. The 1 to 4 employee band changed by -2,768, the 5 to 19 band by -164 and the 20 or more band by -273. Those band differences do not measure entries, exits or job losses.
Non-employing businesses and businesses with 1 to 4 employees represented 538,791 of the total, or 90.3%. Employment-size bands describe the business population. They do not reveal total jobs, capacity, profit, buying intent or demand for marketing services.
+14,730 businesses
Derived annual increase between the published 2024 and 2025 Greater Melbourne snapshots.
90.3% in the two smallest bands
Non-employing businesses and businesses with 1 to 4 employees combined at 30 June 2025.
Employing bands down 3,205
Combined difference across the three employing business bands, not a closure or job-loss count.
+105,030 people
Published Greater Melbourne population increase to 5,435,590 people at 30 June 2025, with the latest estimate marked preliminary.
Keep turnover and industry movement in context
The two turnover bands at $200,000 or more contained 239,384 businesses in 2025, or 40.1% of the total. Turnover bands do not reveal profit, marketing budgets or willingness to buy SEO services.
Transport, postal and warehousing, health care and social assistance, and rental, hiring and real estate services recorded the three largest annual industry count increases. Their combined increase of 8,309 represented 56.4% of the total business count increase. The finding describes published snapshots, not entries, jobs, revenue or a forecast.
Industry evidence can help a journalist, planner or business owner ask better questions. Page and campaign decisions still require query evidence, customer records, competition, conversion capacity and the service areas the business can fulfil profitably.
Compare Melbourne, Hume, Melton and Wyndham at one geography level
Greater Melbourne GCCSA and the four selected LGAs are different geographies. The main report uses the functional Greater Melbourne capital-city region. This inset compares Melbourne, Hume, Melton and Wyndham only because all four records use the same Local Government Area level and LGA 2021 boundary reference.
Melton LGA recorded the highest annual business count growth rate in the selected set at 9.7%, followed by Wyndham at 8.0%, Hume at 3.7% and Melbourne at 3.2%. The LGAs differ materially in population, size, industry mix and operating context, so the rates should not be treated as a league table of commercial potential.
The four LGAs are a selected comparison, not a definition of central, northern or western Melbourne. A suburb, growth corridor, SA3, SA4, LGA and Greater Melbourne GCCSA must not be treated as interchangeable.
The comparison does not prove where search demand, customers, premises, employment or SEO opportunity grew. Multi-location businesses are assigned to one geography, published cells can be confidentialised and historical values can be revised.
Melbourne LGA, code 24600
46,783 businesses at 30 June 2025, up 1,457 or 3.2% from 2024. Population was 194,481.
Hume LGA, code 23270
28,471 businesses at 30 June 2025, up 1,011 or 3.7% from 2024. Population was 278,885.
Melton LGA, code 24650
18,989 businesses at 30 June 2025, up 1,686 or 9.7% from 2024. Population was 231,567.
Wyndham LGA, code 27260
37,664 businesses at 30 June 2025, up 2,786 or 8.0% from 2024. Population was 347,830.
Use the report to improve a Melbourne market brief
Use the business and population evidence to frame a market question, not to choose keywords by itself. A useful brief names the exact geography, customer group, service that can be delivered and the search or customer evidence still needed.
Melbourne, Hume, Melton and Wyndham should not receive duplicate landing pages because a statistical comparison exists. A page needs a distinct customer need, genuine operating coverage, useful local evidence, clear ownership and a measurement plan.
The reusable CSV and SVG can support accurate editorial or educational work. Outreach should lead with a relevant finding, disclose SEO Guys' commercial interest and leave coverage, wording and link treatment to the publisher.
Methodology, geography and responsible reuse
Business, employment-size, turnover and industry evidence comes from the ABS Data by Region 2011 to 2025 release. Population uses the current ABS Regional population release. Every derived value is labelled in the downloadable CSV.
The release uses ASGS Edition 3 for Greater Melbourne, while the LGA inset retains LGA 2021 boundaries. Greater Melbourne is not Melbourne City Council, Melbourne CBD, a suburb, a growth corridor or the whole of Victoria.
The normalized CSV and original SVG are offered under Creative Commons Attribution 4.0. Retain the ABS attribution, SEO Guys credit, source URLs, geography, periods and evidence warnings. Do not imply that the ABS produced or endorsed the analysis.
Sources and further reading
Primary and authoritative sources used to support the factual guidance in this resource.
- Source 01ABS Data by Region Greater Melbourne profile, opens in a new tabOfficial Greater Melbourne profile and download route.
- Source 02ABS Data by Region Greater Melbourne CSV, opens in a new tabBusiness totals, employment size, turnover, industry and population time series.
- Source 03ABS Data by Region methodology 2011 to 2025, opens in a new tabScope, confidentiality, geography, revisions and multi-location business limitations.
- Source 04ABS Regional population 2024 to 2025, opens in a new tabPublished population totals and annual change context.
- Source 05ABS Regional population methodology 2024 to 2025, opens in a new tabPopulation estimation methods, preliminary status and revision information.
- Source 06ABS Greater Capital City Statistical Areas Edition 3, opens in a new tabDefinition of the functional capital city geography used by the current Data by Region release.
- Source 07ABS Local Government Areas Edition 3, opens in a new tabLGA definition and the limitation that ABS LGAs approximate gazetted boundaries.
- Source 08ABS Data by Region Melbourne LGA CSV, opens in a new tabOfficial Melbourne LGA business and population values for the same-level comparison.
- Source 09ABS Data by Region Hume LGA CSV, opens in a new tabOfficial Hume LGA business and population values for the same-level comparison.
- Source 10ABS Data by Region Melton LGA CSV, opens in a new tabOfficial Melton LGA business and population values for the same-level comparison.
- Source 11ABS Data by Region Wyndham LGA CSV, opens in a new tabOfficial Wyndham LGA business and population values for the same-level comparison.
- Source 12ABS website copyright and Creative Commons terms, opens in a new tabCC BY 4.0 terms, attribution requirements and excluded logos, branding and third-party material.